Download
1 / 21
210 likes | 642 Vues
Warm Up. Students were asked, “Are you right-handed, left-handed, or ambidextrous?” The responses of the 50 randomly selected Canadian students are show below. Make an appropriate graph to display these data.

E N D
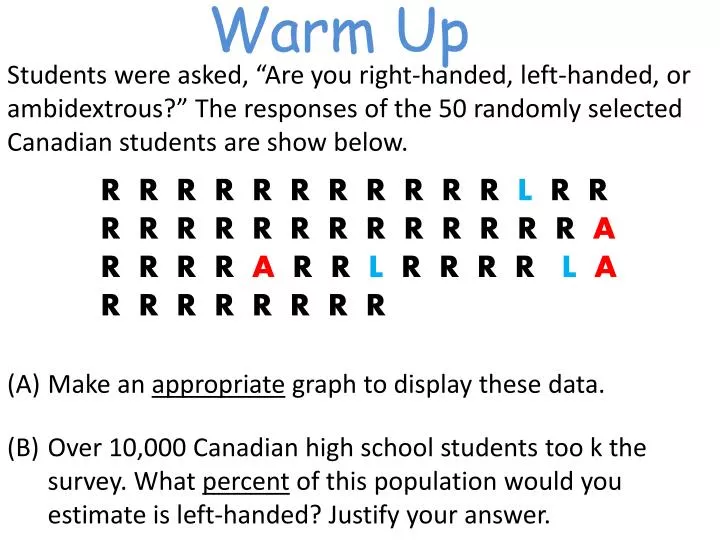
Warm Up Students were asked, “Are you right-handed, left-handed, or ambidextrous?” The responses of the 50 randomly selected Canadian students are show below. Make an appropriate graph to display these data. Over 10,000 Canadian high school students too k the survey. What percent of this population would you estimate is left-handed? Justify your answer. R RRRRRRRRRRL R R R RRRRRRRRRRRRA R RRRAR RLR RRRLA R RRRRRRR
Get Out Your Projects! You must turn in the following. The Computation Project The Compare & Contrast Paper The Computation Rubric The C&C Rubric
5-Number (5#) Summary The five-number summary of a distribution consists of the smallest data point, the first quartile, the median, the third quartile, and the largest data point.
Number of Text Messages First we must put the data in order from smallest to largest. ***Sample Size:
#3 Median The median is the midpoint of the distribution that has been ordered from smallest to largest, such that half of the data points are smaller and half of the data points are larger. Notation: _________
#1 Minimum The minimum is the smallest data point in the data set. Do not exclude any outliers. Notation: ____________
#5 Maximum The maximum is the largest data point in the data set. Do not exclude any outliers. Notation: ____________
#2 Lower Quartile The median for the first 50% of the ordered set is the lower/first quartile. Notation: ___________
What does Q1 Mean? _____________of the people in this room sent less than ___________ text messages. _____________ of the people in this room sent more than __________ text messages.
#4 Upper Quartile The median for the second 50% of the ordered set is the upper/third quartile. Notation: ___________
What does Q3 Mean? _____________of the people in this room sent less than ___________ text messages. _____________ of the people in this room sent more than __________ text messages.
Data Display This is what the quartiles are actually doing with the data set.
Interquartile Range The interquartile range is the range of data between the lower quartile and the upper quartile Notation: __________
Number of Text Messages First we must put the data in order from smallest to largest. ***Sample Size:
#3 Median The way we deal with the median in a data set with an ODD sample size is different. Once we find the median, it cannot be included in another portion (Q1 or Q3).
Number of Tattoos Find the 5# Summary for the following data set. n = _____ 5 1 11 6 0 3 2 0 13 4 4 1 12 7 0 1
Number of Starbucks Coffees Find the 5# Summary for the following data set. n = _____ 05 01 23 14 10 03 00 20 03 24 04 01 12 17
Try It On Your Own One group has an ODD sample size and one group has an EVEN sample size.
Ticket Out The Door On a 3x5 Card write what 5 values the 5# Summary is made up of.
Homework 5# Summary Worksheet