GoMore Network Analysis
GoMore Network Analysis. Kate Lyndegaard GEOG 596A Mentor: Frank Hardisty. Outline. Motivation and summary What is network analysis? The project objective The GoMore network The preliminary results The next steps Thanks. Motivation and Summary. Motivation and Summary.

GoMore Network Analysis
E N D
Presentation Transcript
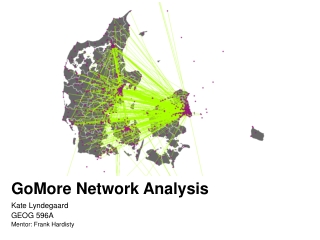
GoMore Network Analysis Kate Lyndegaard GEOG 596A Mentor: Frank Hardisty
Outline • Motivation and summary • What is network analysis? • The project objective • The GoMorenetwork • The preliminary results • The next steps • Thanks
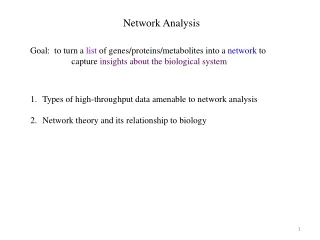
Motivation and Summary • How can we begin to discuss integration of spatial analysis and social network analysis intersect? • Are there elements of geospatial/geostatistical theory which complement social network theoretic approaches to examining context and relationships in networks, and vice versa?
Motivation and Summary • How can we begin to discuss integration of spatial analysis and social network analysis intersect? • Are there elements of geospatial/geostatistical theory which complement social network theoretic approaches to examining context and relationships in networks, and vice versa?
Network Representation A network represents data as a series of ‘nodes’ and ‘edges’ Node Edge
Directed Networks A directed network represents the directionality of events represented by ‘edges’
Weighted Networks Not all networks are represented by edges sharing equal values. Weighted networks attribute additional data to every edge. 6 2 2 15 2 15 10 2
Topological Properties: Degree Centrality measures such as ‘degree’ measure the relative importance of a node within a network. Degree = 5 Out degree = 3 In degree = 2 Out degree = 1 Source: Lotan, G.: Network X and Gephi, NYC PyData Conference 2012
Topological Properties: Path Length Path length measures the number of edges between two nodes. Shortest path length, and average path length (calculated over the entire graph), may also be measured. 1 2 3 4 5 6 Path Length = 2
Analyze the GoMore Network • Analyze the network of Northern Europe’s leading, online ride-share provider:GoMore(www.GoMore.dk)
Analyze the GoMore Network • Examine a number of topological network properties in order to characterize the interconnectivity of GoMore travel • Examine weighted network properties in order to analyze the significance of the volume of travel • Determine whether or not there is a correlation between population density and the volume of travel between network nodes
Creating the Network Graph Technologies employed: • PostgreSQL: Advanced SQL queries to structure data • Gephi: Generate .GML (graph file), visualization, analyses • igraphas R package: Implement network analysis algorithms • R: Implement statistical methods, visualization • ArcGIS for Desktop: Spatial analyses, visualization, feature attribution, processing of demographic data
Creating the Network Graph: PostgreSQL ‘nodes’ table
Creating the Network Graph: PostgreSQL ‘edges’ table
Creating the Network Graph: Gephi GoMore network graph: Circular Layout
Clustering Spectrum: Average Local Clustering Coefficient vs. degree Source: Barabási, A.L.: Network Science. Forthcoming, pp. 41
Next Steps • Complete and refine weighted network analyses • Refine spatial analyses • Discuss correlations between network and spatial analyses • Complete journal article for peer-review (GIScience 2014, Vienna, Austria)
References Albert, R., Barabási, A. L.: Topology of evolving networks: local events and universality. Physical review letters 85.24, 5234 (2000). Barabási, A.L.: Network Science. Forthcoming. Barabási, A.L., Albert, R.: Emergence of Scaling in Random Networks. Science 286.5439, 509-512 (1999) Barthélemy, M., Barrat, A., Pastor-Satorras, R., Vespignani, A.: Characterization and modeling of weighted networks. Physica a: Statistical mechanics and its applications 346.1, 34-43 (2005) Barrat, A., Barthelemy, M., Pastor-Satorras, R., Vespignani, A.: The architecture of complex weighted networks. PNAS 101.11, 3747-3752 (2004) Clauset, A., Shalizi, C. R., Newman, M. E.: Power-law distributions in empirical data. SIAM Review 51.4, 661-703 (2009) De Montis, A., Barthélemy, M., Chessa, A., Vespignani, A.: The structure of inter-urban traffic: A weighted network analysis. arXiv preprint physics/0507106 (2005) De Montis, A., Caschili, S., Chessa, A.: Spatial Complex Network Analysis and Accessibility Indicators: the Case of Municipal Commuting in Sardinia, Italy. EJTIR 4.11, (2011) De Montis, A., Chessa, A., Campagna, M., Caschili, S., Deplano, G.: Modeling commuting systems through a complex network analysis: A study of the Italian islands of Sardinia and Sicily. Journal of Transport and Land Use 2.3, (2010) Easley, D., Kleinberg, J.: Networks, crowds, and markets. Cambridge, Cambridge University Press (2010) Erdős, P., Rényi, A.: On the evolution of random graphs. Magyar Tud. Akad. Mat. Kutató Int. Közl 5, 17-61 (1960). Gallego, F. J.: A population density grid of the European Union. Population and Environment 31.6, 460-473 (2010). Gastner, M. T., Newman, M. E.: The spatial structure of networks. Eur. Phys. J. B 49.2, 247-252 (2006) Gorman, S. P., Kulkarni, R.: Spatial small worlds: new geographic patterns for an information economy. arXiv preprint cond-mat/0310426, (2003) Liben-Nowell, D., Novak, J., Kumar, R., Raghavan, P., Tomkins, A.: Geographic routing in social networks. PNAS 102.33, 11623-11628 (2005) Newman, M. E.: Analysis of weighted networks. Physical Review E 70.5, 056131(2004). Onnela, J. P., Saramäki, J., Kertész, J., Kaski, K.: Intensity and coherence of motifs in weighted complex networks. Physical Review E 71.6, 065103 (2005) Patuelli, R., Reggiani, A., Gorman, S. P., Nijkamp, P., Bade, F. J.: Network analysis of commuting flows: A comparative static approach to German data. Networks and Spatial Economics 7.4, 315-331 (2007) Travers, J., Milgram, S.: An experimental study of the small world problem. Sociometry 4, 425-443 (1969) Watts, D. J., Strogatz, S. H.: Collective dynamics of ‘small-world’networks. Nature 393.6684, 440-442 (1998) Yook, S. H., Jeong, H., Barabási, A. L.: Modeling the Internet's large-scale topology. PNAS 99.21, 13382-13386 (2002).
Thanks I would like to thank Beth King and Frank Hardisty