
Exploring the Growth of Motor Vehicle Registrations and Categorical Data Relationships
This analysis explores the increasing number of motor vehicles registered in the U.S., examining trends over time and identifying the linear growth pattern after outlier removal. The LSRL equation is derived, shedding light on the model governing vehicle registration. Additionally, we delve into two-way tables to analyze categorical data using percentages and distributions. We compute marginal and conditional distributions regarding college demographics and a high school survey on political affiliations, illustrated with bar graphs for clearer interpretation.

Exploring the Growth of Motor Vehicle Registrations and Categorical Data Relationships
E N D
Presentation Transcript
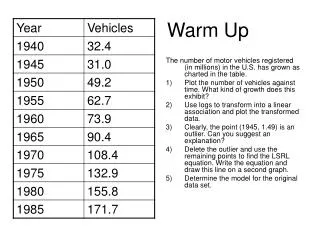
Warm Up The number of motor vehicles registered (in millions) in the U.S. has grown as charted in the table. • Plot the number of vehicles against time. What kind of growth does this exhibit? • Use logs to transform into a linear association and plot the transformed data. • Clearly, the point (1945, 1.49) is an outlier. Can you suggest an explanation? • Delete the outlier and use the remaining points to find the LSRL equation. Write the equation and draw this line on a second graph. • Determine the model for the original data set.
4.2: Relationships between Categorical Variables Two-Way Tables • To analyze categorical data, we use the counts or percents of individuals that fall into various categories; finding percentages is the key to “describing the relationships” among categorical variables. • Round-off Error = okay • To calculate percentages = favorable/possible • Two types of distributions: Marginal distributions (has to do with what goes into the margins – the counts for each row and column) – calculated from marginal frequencies - label as percentages. Each marginal distribution from a two-way table is a distribution for a single categorical variable which can then be displayed as a bar graph or pie chart. Conditional distributions (has to do with calculating the distribution of percents for one variable across some condition on the other variable); reveals the nature of an association
Census Bureau data describing the age and sex of college students 1) Row Variable/Column Variable/Marginal Distributions/Roundoff Error 2) % of college students that are women? 3) % of college students who are 18-24? 4) Marginal distribution of age group in percents (Graph next slide). 5) % of college students that are women in the 18-24 age group? % of college students that are men in the 18-24 age group? (Conditional dist.) 6) % of college students that are women in the 35+ age group? % of college students that are men in the 35+ age group? (Conditional dist.) 7) % of female college students in four age groups?
Left Graph: Bar graph of the distribution of age for college students (marginal dist.)Right graph: Comparing the percent of female college students in four age groups.*Common to display categories on x-axis and frequencies (or %s) on y-axis*
In a survey at a public high school, a random sample from each class was asked whether they considered themselves to be a Democrat or a Republican. Here is the data • What are the row and column variables? • Calculate the Marginal Frequencies by Grade and by Voting Party. • Calculate the Marginal distributions byGrade and by Voting Party. • Compute the conditional distribution of Freshmen who are Republicans. • Compute the conditional distribution of Seniors who are Democrats. • Draw a bar graph depicting the marginal distribution of the sample across grade. • Draw a bar graph comparing the percent of democrats across the four grades.
Accident victims are sometimes taken by helicopter from an accident to a hospital. Helicopters save time. Do they also save lives?


