Neuroimaging
Neuroimaging. What is neuroimaging? Types of neuroimaging Subtractive methodology What can neuroimaging tell us about cognition? Summary. Brief History of Brain Mapping.

Neuroimaging
E N D
Presentation Transcript
Neuroimaging What is neuroimaging? Types of neuroimaging Subtractive methodology What can neuroimaging tell us about cognition? Summary
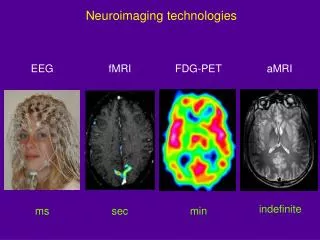
Brief History of Brain Mapping • In 1929 Berger first recorded brain electrical activity (EEG) at the human scalp suggesting it could be a tool to investigate mental states. • In the 50s the introduction of radioactive tracers as a quantitative measure to study blood flow, and later the use of X-ray CT scan and PET provided effective methods to study the brain. • The introduction of fMRI offered the use of a non-invasive technique which could be applied to the study of cognitive function in normal volunteers using the subtractive methodology.
Electro-encephalography (EEG) • Electric and magnetic activity occurs naturally in the brain and seems to encode information about brain functions thus allowing us to make some inferences about ‘mental states’. • In EEG, a number of electrodes are placed over the scalp and these record the activity of neurons over a period of time (temporal). • The EEG trace varies according to the general state of the brain (asleep, awake etc).
EEG • When we are quiet or asleep, EEG waves are synchronised, with a wave-like shape, with waves being of a particular amplitude and frequency (usually alpha waves, 8-12 Hz). • When we are awake and thinking, the EEG wave tends to be de-synchronised, which means there is an irregular electrical activity. • Electrical and magnetic activity in the brain can be time-locked to a specific stimulus or event, and event-related potentials (ERPs) or event-related fields (ERFs) can be measured.
Event Related Potentials (ERP) • ERPs are a sequence of positive and negative voltage deflections or components (N400) that have specific time delays and wave shapes. • The evoked response to a single stimulus at the scalp is tiny and is extracted from background activity by means of the averaging technique which enhances the amount of signal and reduces the amount of noise to nearly zero. • Brain activity is revealed by ERPs with a very high degree of temporal precision (milliseconds) but with a rather poor spatial resolution.
Positron Emission Tomography (PET) • The brain stores no oxygen and little glucose so the energy necessary for continuous neural activity depends on blood supply. • Measures of blood flow can be obtained by means of a tracer in the blood which can provide valuable information on brain activity. • PET uses radioactive tracers, usually 15O2, which have a short half-life (approximately 2 minutes) and this allows the experimenter to perform several scans on the same subject.
Regional cerebral blood flow (rCBF) • A tracer is injected into a vein and it enters the brain in about 30 seconds then while it is breaking down it gives a picture of regional blood flow (rCBF) in specific parts of the brain. • As the tracer breaks down to its stable form, it emits a positron, which will collide with an electrode to produce two annihilation photons and these are detectable by the imaging device. • The spatial resolution of PET is determined by the distance traveled by the positron before its annihilation, and is approximately 2-3 mm.
Data analysis • The classical approach to imaging techniques uses the so-called ROI (region-of-interest) approach: regions that would be analysed for changes in blood flow or metabolic activity are chosen a-priori and then scanned. • This approach is best applied when the brain region is known in advance i.e. the primary sensorimotor cortices such as vision/audition. • A-priori approach not suited to higher functions such as language and attention because of individual differences in brain localisation.
Subtraction methodology • PET studies use a different approach called the subtraction methodology. • In this approach two different brain states are compared: a control state (usually rest) which is subtracted from a task state (usually a decision) in order to create a difference image. • This image tells us which areas in the brain are involved in the task state. • Depends on an assumption of feed-forward information processing (see Van Orden, 2001).
Problems with subtraction methodology • True theories of cognition? • Modularity? • Feedback effects (interactivity)?
Pure insertion? • The assumption of "pure insertion". • This assumption is the main criticism leveled at PET studies: by comparing a task state to a control state we assume that the differences we observe represent the processing components introduced by the task itself and do not reflect the processes of the control state at all. • This can be overcome by designing the control task to contain the same components as the E (experimental) task except for the critical variable of interest.
Averaging data • PET results are usually averaged acrosssubjects in order to enhance the signal-to-noise properties of the images. • Averaging is a controversial procedure but the averaging principles that are used in PET studies are common to all subjects and the algorithms used for both across-subjects and within-subjects averaging are very powerful. • The subtraction and averaging techniques require a common reference system for the localisation of activated areas in each brain.
Talairach co-ordinates • Most researchers refer to various brain regions according to Brodmann’s areas or classical names such as that of Broca's area but the use of standardised reference points is preferable. • A common reference system is provided by the Talairach stereotaxic space atlas of the human brain and software packages (e.g. SPM) have been developed to standardise brain images. • This methodology allows us to define areas of activation, their borders and volume in a commonly accepted and comprehensible way.
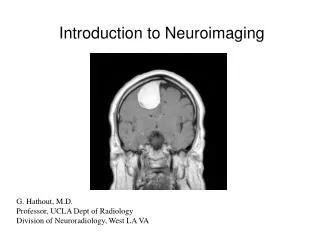
Magnetic Resonance Imaging (MRI) • MRI is a non-invasive technique that uses a magnetic field in order to elicit a detectable signal that can create a spatial brain image. • The subject is placed in a uniform magnetic field and an appropriate radio-frequency is then transmitted through the field for a brief period. • Resonance in atomic nuclei (hydrogen atoms) are detected by a receiver coil around the head • An image of the brain can be formed in which tissue of different density are distinguishable with a spatial resolution of about 2 millimetres.
Functional MRI (fMRI) • Several techniques have been developed to adapt MRI as a measure of brain structure to measuring brain activity using blood flow. • The most commonly technique is the Blood Oxygen Level Dependent (BOLD) method. • fMRI does not require external tracers but uses instead the magnetic properties of an internal substance (haemoglobin) in order to provide the tracer by which brain activity can be analysed.
Oxygen metabolism • Neural activity causes a large increase of blood flow but a small change in oxygen consumption leading to an increase in the proportion of oxygenated haemoglobin in brain tissue. • The magnetic properties of oxygenated haemoglobin differ from those of deoxygenated haemoglobin so activateareas are visible by changes in signal intensity measured by MRI.
Echo planar imaging (EPI) • fMRI images are collected sequentially. • Fast data acquisition techniques such as echo planar imaging (EPI) are used to avoid the image recorded at one point in the brain reflecting activity occurring at a slightly different time in another part of the brain. • One property of fMRI is the opportunity to run correlational studies because it is possible to look for a temporal correlation between a particular input (e.g. a stimulus) and the resulting response in one part of the brain.
Data analysis • fMRI data are collected as a rapid sequence of scans making it possible to observe the changes occurring in brain activity in different areas at many different points in time. • Data analysis in fMRI studies is approached by using thresholding techniques an approach which proved to be powerful in PET. • These methods attempt to fix a-priori a threshold above which a response can be considered statistically significant.
Statisitical Parametric Mapping (SPM) • Software packages have been produced for this purpose among them SPM (statistical parametric mapping) is the best known. • Statistical parametric maps are images in which voxels are distributed according to a probability density function based on activity. • These maps are images of significance whose simplest forms are t scores based on repeated measurements of rCBF data in two different brain states (e.g. task vs control).
CS CB PS CS CB PS PB PB 28 28 28 28 28 28 28 28 CS PS CS CB PS CB PB PB 28 28 28 28 28 28 28 28 Stim: 3.0 sec Fixn : 0.5 sec 8 stim/ block PS Block Timing Diagram X2 PS= picture semantics PB= picture size judgement CS= character semantics CB= character size judgement
Word stimuli Associative Semantics Size Judgment
Character stimuli Associative Semantics Size Judgment
Picture stimuli Associative Semantics Size Judgment
FRONTAL PARIETAL TEMPORAL OCCIPITAL CEREBELLUM
Magnetoencephalography (MEG) • Magnetoelectroencephalography (MEG) can be performed during fMRI scans of the brain by deriving event-related magnetic fields (ERF’s). • MEG has the same temporal resolution as EEG but also allows the experimenter to localise the source of the ERF quite reliably. • This enables direct intervention and precise monitoring of electrical activity in the brain with reliable spatial resolution (2 for the price of 1).
Problems with MEG • This spatial resolution is restricted to the gyri and sulci of the lateral surface of the brain that are oriented parallel (near to) the scalp. • Therefore MEG cannot tell us anything about the activity of the bulk of the human neo-cortex under the lateral surface at this stage. • It is useful for measuring the reaction time taken to perform a cognitive task (like reading) and for tracking changes in location that occur during brain activity over time intervals.
Summary • Different methods of brain imaging can give a converging picture of how the brain works. • Brain imaging studies may tell us about the regions of the brain that are used for specific behaviours and possibly cognitive processes. • Brain imaging studies can be used to test hypotheses derived from cognitive theories.
References • Bub, D.N. (2000). Methodological issues confronting pet and fMRI studies of cognitive function. Cognitive Neuropsychology 17(5), 467 -- 484 • Poeppel D. (1996a) A critical review of PET studies of phonological processing. Brain and Language, 55, 317-351. • Poeppel, D. (1996b). Some remaining questions about studying phonological processing with PET: Response to Demonet, Fiez, Paulesu, Petersen, and Zatorre. Brain and Language, 55, 380-385. • Van Orden, G.C. and Paap, K.R. (1997). Functional neuroimages fail to discover pieces of mind in the parts of the brain. Philosophy of Science, 64 (4S):S85-S94.