Comparison of Background Fluorescence of UVM11 at CFP and GFP Wavelengths
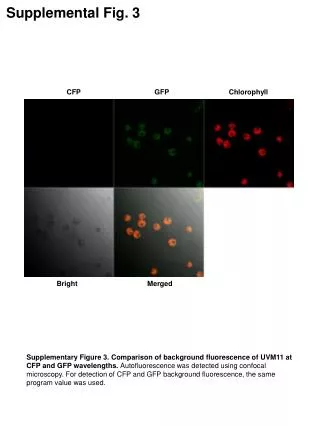
This supplemental figure illustrates the background fluorescence of UVM11 at CFP and GFP wavelengths as detected through confocal microscopy. The images demonstrate the autofluorescence patterns obtained, providing a clear comparison between the two fluorescent markers. The same program settings were applied for both CFP and GFP fluorescence detection, ensuring consistency in the results. This analysis is crucial for understanding the background noise in fluorescence studies and optimizing the use of CFP and GFP in experiments.

Comparison of Background Fluorescence of UVM11 at CFP and GFP Wavelengths
E N D
Presentation Transcript
Supplemental Fig. 3 CFP GFP Chlorophyll Bright Merged Supplementary Figure 3. Comparison of background fluorescence of UVM11 at CFP and GFP wavelengths. Autofluorescence was detected using confocal microscopy. For detection of CFP and GFP background fluorescence, the same program value was used.