Download
1 / 37
370 likes | 600 Vues
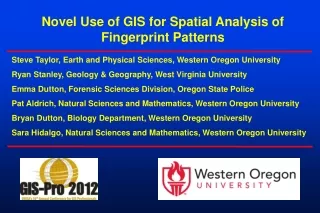
Novel Use of GIS for Spatial Analysis of Fingerprint Patterns. Steve Taylor, Earth and Physical Sciences, Western Oregon University Ryan Stanley, Geology & Geography, West Virginia University Emma Dutton, Forensic Services Division, Oregon State Police

E N D
Novel Use of GIS for Spatial Analysis of Fingerprint Patterns Steve Taylor, Earth and Physical Sciences, Western Oregon University Ryan Stanley, Geology & Geography, West Virginia University Emma Dutton, Forensic Services Division, Oregon State Police Pat Aldrich, Natural Sciences and Mathematics, Western Oregon University Bryan Dutton, Biology Department, Western Oregon University Sara Hidalgo, Natural Sciences and Mathematics, Western Oregon University
Introduction • Project Background • GIS Methodology • Data Model • Standardized Coordinate System • Workflow • Example Applications • Pattern Characterization • Geometric Morphometrics • Monte Carlo Simulations • Summary and Conclusion
NOVEL LINKAGES: GIS AND FINGERPRINT MAPPING So a Geologist, Biologist and Forensic Scientist walk into a bar…the bartender asks: “How are fingerprints like a volcano?” The Geologist says: “I’m not sure, but I bet we can use GIS to find out”. The punch line follows… • Fundamental • Map Elements • Points • Lines • Polygons Newberry Volcano
Western Oregon UniversityFingerprint Analysis and Characterization Team “FACT” Interdisciplinary Collaboration: Earth Science, Biology and Forensic Science Three-year National Institute of Justice grant Project Title: “Application Of Spatial Statistics To Latent -Print Identifications: Towards Improved Forensic Science Methodologies” Project Goal: To apply principles of GIS and spatial analysis to fingerprint characterization
PROJECT IMPETUS Feb 2009 National Academy of Science report: “Strengthening Forensic Science in the United States: A Path Forward” Recommendation 3: Indicated need to improve the scientific accuracy and reliability of forensic science evidence, specifically impression-based evidence, including fingerprints
Objectives Use Geographic Information Systems spatial analyses techniques to: • Evaluate fingerprint characteristics or attributes • Minutiae type (bifurcations and ridge endings) • Minutiae distribution (per finger / pattern type) • Ridge line distribution • Establish robust probabilistic models to • Quantify fingerprint uniqueness and • Establish certainty levels for latent print comparisons
FINGERPRINT MORPHOLOGY AND FEATURES IDENTIFICATION: -Minutiae Position -Minutiae Type -Minutiae Direction -Ridge Counts -Ridge “Flow” -Print Type ASSUMPTION: Fingerprints are Biologically Unique Minutiae Points Print Type = LS Friction Ridge Lines Master 1_1li
PRIMARY FINGERPRINT TYPES Left Slant Loop Arch Right Slant Loop Whorl
Research Design: Application of GIS GIS: A collection of hardware and software that integrates digital map elements with a relational database. Cartography + Database Technology + Statistical Analysis Vector Customers Core to Minutiae Distances and Ridge Counts Streets Parcels Minutiae Elevation Raster Land Usage Fingerprint Skeleton Real World Fingerprint Image Source: ESRI B. GIS Applied to Fingerprints A. Example GIS Application
Fingerprint Data Management • Fingerprint image acquisition and minutiae detection • Georeferencing and verification • GIS data conversion and management • Raster fingerprint images • Vector minutiae point layers • Vector friction ridge line layers • Spatial analysis of ridge line and minutiae distributions • Statistical analysis and probability modeling
Scan, Segregate & Image Enhancement Noise filter, black/white balance, contrast & brightness enhancements
Geo-referencing: Standardized Coordinate System Core Location Arches = highest point of recurve Loops = highest point of recurve of 1st full loop Whorls = center ridge ending or bulls eye Core centered at (100,100) mm in Cartesian space Print oriented with basal crease parallel to X-axis
GIS Data Conversion Fingerprint Image Fingerprint Minutiae 100 100 100 Skeletonized Ridge Lines 100 100 100 Ridge and Minutiae Attribute Data
Fingerprint Skeletonization and Vectorization Coded Ridgeline Attributes
Example GIS-Based Extension TIN (Delaunay) Triangles 1. Vectorized fingerprint 2. Minutiae 3. TIN polygons 4. TIN polylines 5. TIN ridge counts
2-mm Grid Cell Minutiae Density All Minutiae 0 0.001 0.01 0.036 0.076 0.14 0.436 n = 348 C. Whorls n = 251 E. Arches n = 54 A. Left Slant Loops B. Right Slant Loops n = 309 D. Double Loop Whorls n = 172 F. Tented Arches n = 66
A. Left Slant Loops B. Right Slant Loops C. Whorls D. Double Loop Whorls E. Arches F. Tented Arches 2-mm Grid Cell Ridge Line Density
Minutiae / Ridge Frequency Ratio • Above Core • Minutiae: 33 • Ridge Lines: 81 • Minutiae/Ridge Ratio: 0.41 • Below Core • Minutiae: 63 • Ridge Lines: 100 • Minutiae/Ridge Ratio: 0.63 • Compared minutiae / ridge count ratios above and below the core for 188 vectorized fingerprints (all pattern types) • Paired t-test: • t = -24.525, df = 187 • mean difference = -0.19 • p-value < 2.2e-16 • Difference in minutiae / ridge ratios above and below core is significant with a p < 2.2e-16
Findings: Pattern Characterization • Project Compilation: • 1,200 fingerprints • 102,000 minutiae • 20,000 ridge lines • Avg. No. Minutiae per Print = 85.1 • Ridge Ending/Bifurcation Ratio = 1.4 • Minutiae and ridge lines most densely packed in the region below the core, with the greatest line-length density surrounding the core • Increased ridge line curvature associated with increased minutiae density
Geometric Morphometrics Figure from Zelditch, M.L., D.L. Swiderski, H.D. Sheets, and W.L. Fink. 2004. Geometric Morphometrics for Biologists: A Primer. Elsevier Academic Press: London. A spatial statistical method to study biological shape Requires the designation of points or areas that are homologous across samples (landmarks and semi-landmarks) Allows shape variation analysis across samples by removing size and rotation effects
Fingerprint Morphometrics Example Left Slant Loop
Findings: Geometric Morphometrics • Geometric morphometric techniques are applicable to fingerprint patterns • Potential Research Directions: • Geometric comparison of fingerprint types between left and right hands • Analysis of hyper-variable regions of fingerprints outside landmarks and semilandmarks • Analysis of the effects of elastic skin deformation and spatial distortion in fingerprints
EXAMPLE APPLICATION:Monte Carlo Simulation and Estimating False Match Probabilities
Monte Carlo Simulation Iterative random sampling of select minutiae to obtain probabilities of false matches based on coordinate location and point attributes 9 grid-filter cells, each overlapping by 50% across entire print space 3-5-7-9 minutiae systematically sampled in each grid cell Simulation iterated 1000 times per print per grid cell 50 prints selected across four pattern types (LS Loops, RS Loops, Whorls, Double Loop Whorls) yielding a total of 50,000 iterations per grid cell
Monte Carlo Simulation: Looking for False matches Legend Fingerprint Convex Hull Ridge Ending Bifurcation Core Delta 120 Grid Cell Grid Cell 7 Grid Cell 8 Grid Cell 9 110 Y Coordinate (mm) Grid Cell Grid Cell 5 Grid Cell 6 Grid Cell 4 100 90 Grid Cell Grid Cell 1 Grid Cell 2 Grid Cell 3 80 110 130 100 70 80 90 120 X Coordinate (mm)
Example False Match – 7 Minutiae, Grid Cell 5 Selected Print: LS Loop – Left Index False Match: Whorl – Left Thumb Matching Minutiae Y Coordinate (mm) Y Coordinate (mm) X Coordinate (mm) X Coordinate (mm)
Findings: Monte Carlo Simulations • The probability of a false match decreased as the number of selection attributes increased in the MC model. • The probability of a false match decreased as the number of selected minutiae increased. • The probabilities obtained in this study are aligned with other published results that utilize alternative methods and sample sources.
Techniques in Geographic Information Systems were successfully applied to spatially analyze fingerprint patterns • The georeference protocol developed for this study provides a standardized coordinate system that allows complex analysis of minutiae and ridgeline distributions across fingerprint space • A wide variety of spatial analysis tools were developed in the GIS software environment to characterize fingerprint features and statistically characterize distributions between print types • GIS application to fingerprint analysis, identification and pattern characterization represents an untapped resource • The project-related GIS tools and preliminary results offer promising contributions to the advancement of fingerprint analysis and forensic science in the near future.
FUTURE WORK • Apply rubber sheeting and ortho-rectification techniques to elastic skin deformation associated with traditional analog print collection techniques • Conduct Nearest Neighbor false-match simulations using randomly chosen clusters of minutiae • Refine Monte Carlo simulations to capture false-match probabilities at higher minutiae counts • Expand the project database to include fingerprint samples beyond the existing Oregon data set • Standardize the GIS tools and data framework
Acknowledgements • National Institute of Justice (Grant Award # 2009-DN-BX-K228) • Western Oregon University • Oregon State Police, Forensic Services Division and ID Services Division • Undergraduate and Graduate Student Assistants This project was supported by Award No. 2009-DN-BX-K228 awarded by the National Institute of Justice, Office of Justice programs, U.S. Department of Justice. The opinions, findings, and conclusions or recommendations expressed in this publication/program/exhibition are those of the author(s) and do not necessarily reflect those of the Department of Justice.