HIV-Positive Inmates in the Russian Penal System (1994-2003)
This report analyzes the prevalence of HIV-positive inmates within the Russian penal system from 1994 to 2003. Utilizing data sourced from the Main Directorate of Corrections of the Ministry of Justice, it outlines the rising numbers of infected individuals over the years, highlighting a troubling trend in public health and prisoner welfare. The findings illustrate the urgent need for targeted health interventions and policy reforms in correctional facilities to address the HIV epidemic within this vulnerable population.

HIV-Positive Inmates in the Russian Penal System (1994-2003)
E N D
Presentation Transcript
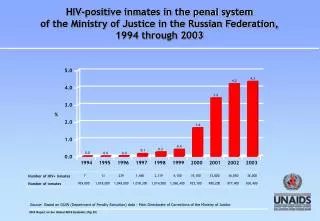
HIV-positive inmates in the penal system of the Ministry of Justice in the Russian Federation, 1994 through 2003 5.0 4.3 4.2 4.0 3.4 3.0 % 2.0 1.6 1.0 0.4 0.2 0.1 0.0 0.0 0.0 0.0 1994 1995 1996 1997 1998 1999 2000 2001 2002 2003 7 13 239 1,460 2,319 4,100 15,100 33,000 36,850 36,000 Number of HIV+ inmates 929,000 1,018,000 1,048,000 1,018,300 1,014,500 1,060,400 925,100 980,200 877,400 830,400 Number of inmates Source: Based on GUIN (Department of Penalty Execution) data - Main Directorate of Corrections of the Ministry of Justice 2004 Report on the Global AIDS Epidemic (Fig 23)