Molecular Profiling of Key Genes in Cancer Progression
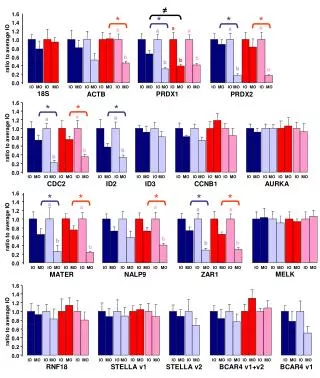
Explore the role of PRDX1, ACTB, PRDX2, CDC2, ID2, ID3, CCNB1, AURKA, MELK, MATER, NALP9, ZAR1, RNF18, STELLAv1, STELLAv2, and BCAR4v1+v2 in cancer progression and their ratios to the average expression levels.

Molecular Profiling of Key Genes in Cancer Progression
E N D
Presentation Transcript
≠ 1.6 * * * * 1.4 a a a a a a 1.2 1.0 ratio to average IO 0.8 b b 0.6 b b b 0.4 b 0.2 0.0 IO MO IO MO IO MO IO MO IO MO IO MO IO MO IO MO IO MO IO MO IO MO IO MO IO MO IO MO 18S PRDX1 ACTB PRDX2 * * * 1.6 1.4 a a a 1.2 1.0 ratio to average IO 0.8 0.6 b b b 0.4 0.2 0.0 IO MO IO MO IO MO IO MO IO MO IO MO IO MO IO MO IO MO IO MO IO MO IO MO IO MO IO MO IO MO IO MO CDC2 ID2 ID3 CCNB1 AURKA * * * * * 1.6 a 1.4 a a a a 1.2 1.0 ratio to average IO 0.8 b 0.6 b b b b 0.4 0.2 0.0 IO MO IO MO IO MO IO MO IO MO IO MO IO MO IO MO IO MO IO MO IO MO IO MO IO MO IO MO IO MO IO MO MELK MATER NALP9 ZAR1 1.6 1.4 1.2 1.0 0.8 ratio to average IO 0.6 0.4 0.2 0.0 IO MO IO MO IO MO IO MO IO MO IO MO IO MO IO MO IO MO IO MO IO MO IO MO IO MO IO MO IO MO IO MO RNF18 STELLA v1 STELLA v2 BCAR4 v1+v2 BCAR4 v1