Analysis of Uronic Acids and Methylesterification in Arabidopsis Cell Walls
This study investigates the content of uronic acids and the degree of methylesterification in cell walls extracted from 4-week-old fully expanded leaves of the Arabidopsis core collection. Quantitative analysis reveals the average uronic acid content and degree of methylesterification, with results displayed alongside standard deviations. Statistical significance was determined using ANOVA followed by Tukey’s test (P < 0.05), highlighting differences among samples. This research contributes to our understanding of cell wall composition in Arabidopsis, with implications for plant biology.

Analysis of Uronic Acids and Methylesterification in Arabidopsis Cell Walls
E N D
Presentation Transcript
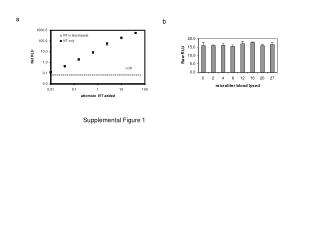
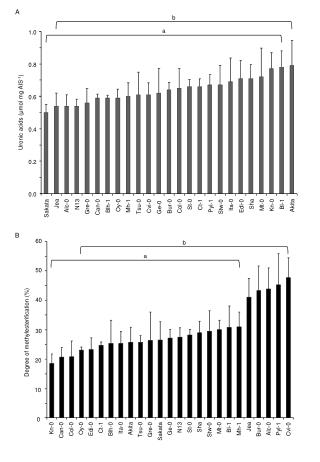
b b a a A 1.0 0.8 0.6 Uronic acids(μmol mg AIS-1) 0.4 0.2 0.0 Jea Sha Bl-1 N13 St-0 Ct-1 Ita-0 Mt-0 Kn-0 Oy-0 Akita Alc-0 Mh-1 Pyl-1 Blh-1 Edi-0 Cvi-0 Col-0 Bur-0 Ge-0 Gre-0 Tsu-0 Stw-0 Can-0 Sakata B 60 50 40 30 Degree of methylesterification (%) 20 10 0 Jea Sha Bl-1 N13 St-0 Ct-1 Ita-0 Mt-0 Kn-0 Oy-0 Akita Ge-0 Mh-1 Alc-0 Pyl-1 Edi-0 Blh-0 Cvi-0 Col-0 Bur-0 Tsu-0 Gre-0 Stw-0 Can-0 Sakata
Figure S2: Quantification of uronic acids and degree of metylesterification in cell walls of the Arabidopsis core collection. Uronic acid content (A) and degree of methylesterification (B) were analysed in cell walls extracted from 4-week-old fully expanded leaves- Bars represent averages ± SD (n=10). Different letters indicate statistically significant differences, according to ANOVA followed by Tukey’s test (P <0.05).