
Warm Up
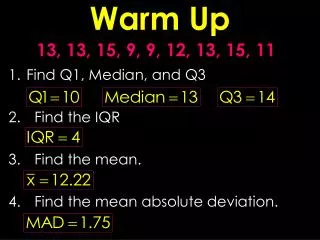
Find Q1, Median, and Q3 Find the IQR Find the mean. Find the mean absolute deviation. Warm Up. 13, 13, 15, 9, 9, 12, 13, 15, 11. Line of Best Fit. Linear Regression. Entering Data : TI 30X. 2 nd DATA choose 2-VAR DATA (enter data and use down arrow) STAT VAR Arrow over to find a =

Warm Up
E N D
Presentation Transcript
Find Q1, Median, and Q3 Find the IQR Find the mean. Find the mean absolute deviation. Warm Up 13, 13, 15, 9, 9, 12, 13, 15, 11
Line of Best Fit Linear Regression
Entering Data : TI 30X • 2ndDATA choose 2-VAR • DATA (enter data and use down arrow) • STAT VAR • Arrow over to find • a = b = r = • The equation of the line is y = ax + b. • Correlation Coefficient is r. • To predict use a(predict #) + b. Estimated method
Entering Data : TI 36X - Pro • DATA (type in data) • 2nd DATA • 2 VAR L1 L2 Frequency of 1 Calc • a = b = r = • The equation of the line is y = ax + b. • Correlation Coefficient is r. • To predict use a(predict #) + b. Estimated method • You can use the x variable button to find a and b
Example 1: The table shows the total outstanding consumer debt (excluding home mortgages) in billions of dollars in selected years. (Data is from the Federal Reserve Bulletin.) Let x = 0 correspond to 1985. a) Find the regression equation appropriate for this data set. Round values to two decimal places.
Example 1: • Find and interpret the slope of the regression equation in the context of the scenario. 79.86 represents the increase in consumer debt each year. • Find the approximate consumer debt in 1998. • Find the approximate consumer debt in 2008.
Example 2: The table below shows the number of deaths per 100,000 people from heart disease in selected years. (Data is from the U.S. National Center for Health Statistics.) Let x = 0 correspond to 1960. a) Find the regression equation appropriate for this data set. Round values to two decimal places.
Example 2: • Find and interpret the slope of the regression equation in the context of the scenario. -7.62 is the decrease in deaths caused by heart disease each year. • Find the approximate number of deaths due to heart disease in 1995. • Find the approximate number of deaths due to heart disease in 2008.
Classwork Linear Regression


