Download
1 / 2
20 likes | 137 Vues
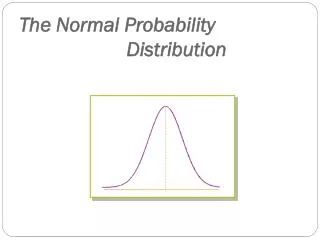
This guide outlines the steps to use a graphics calculator for calculating probabilities and boundary values in the context of normal distribution. For finding the probability between specified boundary values, navigate through the Stats menu and select the appropriate options to input lower and upper limits alongside standard deviation and mean. Conversely, if you're interested in finding boundary values given a probability, the instructions will walk you through selecting the correct tail and entering the area, standard deviation, and mean to receive your desired results.

E N D
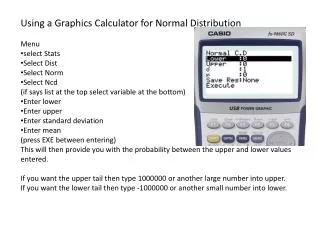
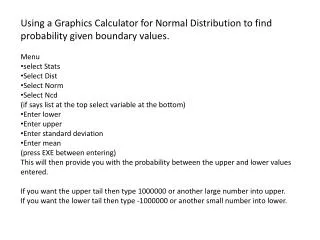
Using a Graphics Calculator for Normal Distribution to find probability given boundary values. • Menu • select Stats • Select Dist • Select Norm • Select Ncd • (if says list at the top select variable at the bottom) • Enter lower • Enter upper • Enter standard deviation • Enter mean • (press EXE between entering) • This will then provide you with the probability between the upper and lower values entered. • If you want the upper tail then type 1000000 or another large number into upper. • If you want the lower tail then type -1000000 or another small number into lower.
Using a Graphics Calculator for Normal Distribution to find boundary values (K) given probability. • Menu • select Stats • Select Dist • Select Norm • Select invN • (if says list at the top select variable at the bottom) • On New Blue calculators Only, enter tail as right, left or centre depending on area you are finding. • Enter Area , this is the probability as a decimal (remember older green calculators need to know the area from the left) • Enter • Enter standard deviation • Enter mean • (press EXE between entering) • This will then provide you with the boundary value you are looking for