CLK Binding Peaks and Gene Cycling Patterns in Circadian Rhythms
90 likes | 208 Vues
This study investigates CLK binding peaks and their relationship with E-boxes in circadian gene regulation. The analysis reveals that CLK peaks are significantly enriched for canonical E-boxes, with distinct cycling patterns observed for peaks with varying E-box structures. A detailed examination of the top 20 genes bound by CLK at specific time points demonstrates robust transcriptional cycling. Additionally, a Fourier analysis identifies non-cycling CLK peaks, many of which show weak oscillations upon visual inspection. This research enhances our understanding of the temporal dynamics of CLK-targeted gene expression.

CLK Binding Peaks and Gene Cycling Patterns in Circadian Rhythms
E N D
Presentation Transcript
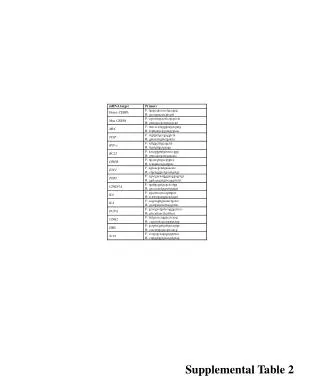
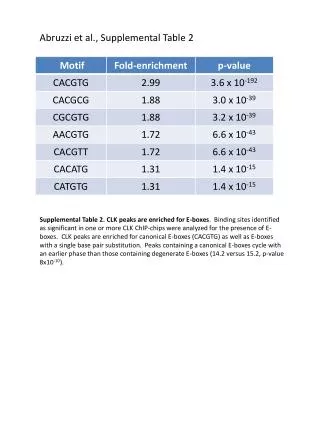
Abruzzi et al., Supplemental Table 2 Supplemental Table 2. CLK peaks are enriched for E-boxes. Binding sites identified as significant in one or more CLK ChIP-chips were analyzed for the presence of E-boxes. CLK peaks are enriched for canonical E-boxes (CACGTG) as well as E-boxes with a single base pair substitution. Peaks containing a canonical E-boxes cycle with an earlier phase than those containing degenerate E-boxes (14.2 versus 15.2, p-value 8x10⁻¹⁰).
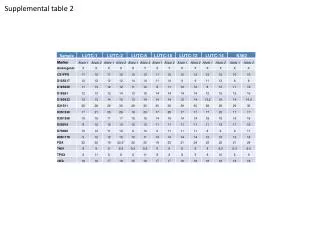
Abruzzi et al., Supplemental Table 3 Supplemental Table 3. List of the top 20 genes bound by CYC at ZT14.
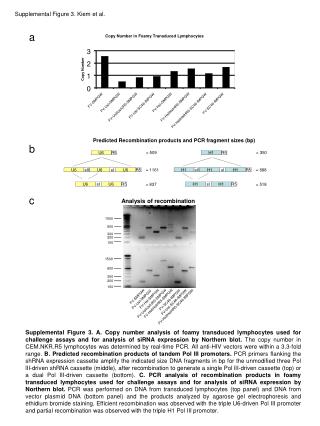
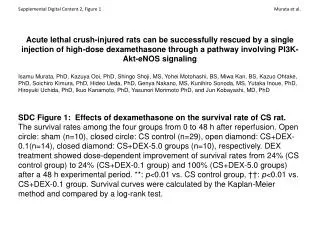
Abruzzi et al., Supplemental Figure 1 1523peaks of CLK binding (p-value <10-4 for at least one timepoint; peak significant in two independent experiments ) 1503 peaks with no significant background signal (Remove peaks present in V5 IP from wild-type) 643peaks do not cycle (F24 score < 0.7) 860peaks cycle (F24 score > 0.7) 319 mapped to >1 gene 44 mapped tointergenic regions (including miRNAs) 497mapped to 1 gene Supplemental Fig. 1. Identification of CLK direct targets. This flowchart outlines how CLK direct targets were identified from ~1500 CLK binding peaks identified by ChIP-chip and MAT analysis. First, any background binding peaks that were also identified in a V5 ChIP-chip from wild-type flies were removed (~20 peaks). Then, cycling peaks were identified using a fourier analysis and a F24 score cutoff of >0.7. Those peaks that cycled were then mapped by visual inspection to the nearest transcription start site, if possible. ~300 genes could not be mapped to one gene because the peak of CLK binding was equidistant between two different transcription start sites. Approximately 500 genes could be mapped to one unique gene.
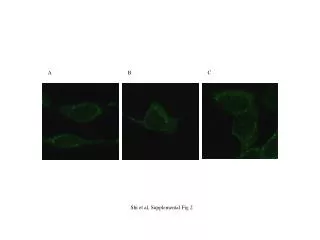
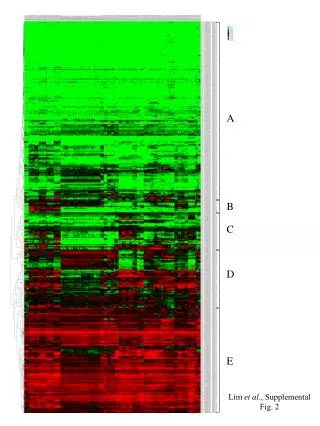
Abruzzi et al., Supplemental Figure 2 A) B) ZT2 ZT6 ZT10 ZT14 ZT18 ZT22 ZT2 ZT6 ZT10 ZT14 ZT18 ZT22 Supplemental Fig. 2. Most CLK peaks identified as non-cycling show oscillations. To identify CLK peaks that cycle, a fourier analysis with fairly stringent cutoffs (F24>0.7 and p-value of <0.05) was applied to the data. Using these cutoffs, approximately 40% of the CLK peaks were labeled as non-cycling. However, when inspected visually, most of these peak cycle weakly and very few show equal levels of CLK binding across all six timepoints. A) CLK ChIP signal of for three randomly chosen non-cycling genes. B) Heatmap showing oscillating ClK binding on all non-cycling CLK direct targets. Data is double plotted to better visualize cycling. As seen for the cycling targets, the maximum CLK binding on these genes occurs at ZT14.
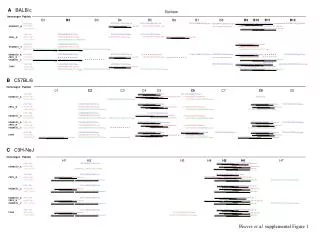
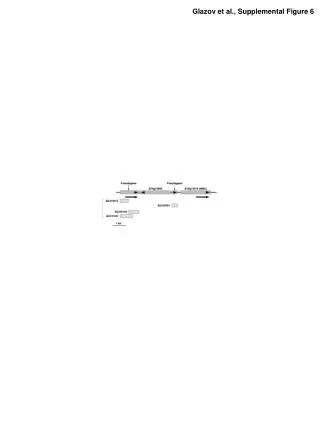
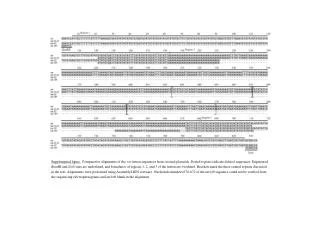
Abruzzi et al., Supplemental Figure 3 Supplemental Fig. 3. CLK, PER and Pol II binding to pdp1 across circadian time. CLK, PER and Pol II ChIP-chip data is visualized in the IGB browser (Affymetrix). Pdp1 is on the bottom strand and transcription is going from right to left. This image shows a zoomed in view so that low levels of binding can be seen at non-maximal timepoints. CLK binding begins at ZT10, increases to its maximum at ZT14, and low levels of binding are still observed at ZT18. PER binding begins at ZT14, is maximal at ZT18, and lower levels are observed at ZT22. Pol II signal in the ORF (transcription) begins at ZT6, is maximal at ZT10 and then starts to decrease at ZT18. By showing all three in the same browser one can get a sense of the temporal control: As soon as CLK binds, transcription begins. PER binding begins at ZT14 as transcription begins to decrease. PER binding increases further at ZT18 and then both CLK and PER are released from the DNA ZT22.
Abruzzi et al., Supplemental Figure 4 A) F) CG9894 Lk6 mRNA relative to RPL32 mRNA relative to RPL32 2 6 10 14 18 22 2 6 10 14 18 22 2 6 10 14 18 22 2 6 10 14 18 22 ZT B) G) ZT dlg1 lilli mRNA relative to RPL32 mRNA relative to RPL32 2 6 10 14 18 22 2 6 10 14 18 22 2 6 10 14 18 22 2 6 10 14 18 22 ZT C) H) ZT treh pABP mRNA relative to RPL32 mRNA relative to RPL32 2 6 10 14 18 22 2 6 10 14 18 22 2 6 10 14 18 22 2 6 10 14 18 22 D) I) ZT ZT cbt CG32486 mRNA relative to RPL32 mRNA relative to RPL32 2 6 10 14 18 22 2 6 10 14 18 22 J) 2 6 10 14 18 22 2 6 10 14 18 22 E) ZT ZT nap1 MESR4 mRNA relative to RPL32 mRNA relative to RPL32 2 6 10 14 18 22 2 6 10 14 18 22 ZT 2 6 10 14 18 22 2 6 10 14 18 22 ZT
Abruzzi et al., Supplemental Figure 5 A) F) gol CG30497 mRNA relative to RPL32 mRNA relative to RPL32 2 6 10 14 18 22 2 6 10 14 18 22 2 6 10 14 18 22 2 6 10 14 18 22 B) G) ZT ZT nat1 CG31324 mRNA relative to RPL32 mRNA relative to RPL32 2 6 10 14 18 22 2 6 10 14 18 22 2 6 10 14 18 22 2 6 10 14 18 22 C) H) ZT ZT JIL-1 mRNA relative to RPL32 14-3-3zeta mRNA relative to RPL32 2 6 10 14 18 22 2 6 10 14 18 22 2 6 10 14 18 22 2 6 10 14 18 22 ZT ZT D) I) CG18317 picot mRNA relative to RPL32 mRNA relative to RPL32 2 6 10 14 18 22 2 6 10 14 18 22 2 6 10 14 18 22 2 6 10 14 18 22 ZT E) J) ZT dbt lim1 mRNA relative to RPL32 mRNA relative to RPL32 2 6 10 14 18 22 2 6 10 14 18 22 2 6 10 14 18 22 2 6 10 14 18 22 ZT ZT
Supplemental Fig. 4. Only ~20% of mRNAs from non-cycling-Pol II bound CLK targets cycle. Q-RT-PCR was performed on six timepoints of total RNA extracted from wild-type (yw) fly heads and normalized relative to rpl32. Values are double plotted to better visualize cycling. To be considered cycling, mRNAs have to show cycling with an amplitude of >1.5-fold and have at least one timepoint that is high. A) CG9894 doesn’t cycle, B) lilli doesn’t cycle, C) pAbpcycles, D) cbt doesn’t cycle, E) nap1 doesn’t cycle, F) lk6 doesn’t cycle, G) dlg1 cycles, H) treh doesn’t cycle, I) CG32486 doesn’t cycle, J) mesr4 doesn’t cycle. Supplemental Fig. 5. Most genes bound by Pol II show cycling mRNA. Q-RT-PCR was performed on six timepoints of total RNA extracted from wild-type (yw) fly heads and normalized relative to rpl32. Data is double plotted to better visualize cycling. To be considered cycling, mRNAs have to show cycling with an amplitude of >1.5-fold and have at least one timepoint that is high. A) gol cycles, B) CG31324 cycles, C) jil-1 cycles, D) picot cycles, E) dbt doesn’t cycle (amplitude only 1.4-fold), F) CG30497 cycles, G) nat1 cycles, H) 14-3-3zeta cycles, I) CG18317 cycles, J)lim1 doesn’t cycle (amplitude only 1.4-fold).
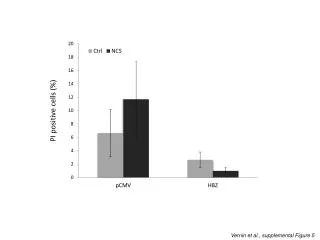
Abruzzi et al., Supplemental Figure 6 gol A) ZT Supplemental Fig. 6. mRNA levels of gol inGMR-hid. To determine whether gene expression is eye-enriched, q-RT-PCR was used to examine mRNA levels in wild-type (CLK-V5 background) orGMR-hid (CLK-V5,GMR-hid) fly heads. golis a CLK target primarily in eye tissue and, indeed, mRNA levels are greatly diminished inGMR-hid suggesting gol is primarily expressed in the eyes.