Download
1 / 21
210 likes | 233 Vues
Global Ice Sheet Mapping Observatory (GISMO). Ohio State Univ., JPL, Univ. Kansas, VEXCEL Corp., E.G&G Corp., Wallops Flight Facility. GISMO: Create new 3-D mosaics of Greenland and Antarctica stripped of their icy cover. Objectives.

E N D
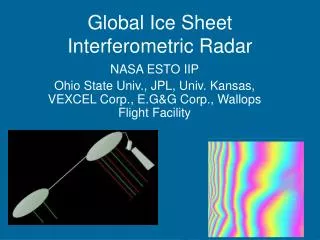
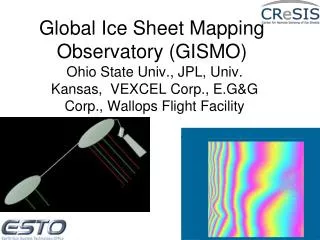
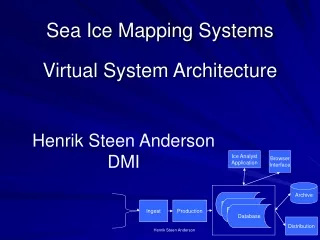
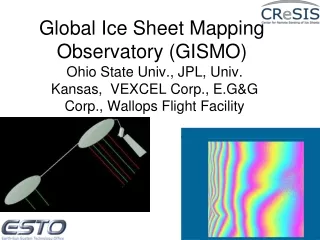
Global Ice Sheet Mapping Observatory (GISMO) Ohio State Univ., JPL, Univ. Kansas, VEXCEL Corp., E.G&G Corp., Wallops Flight Facility
GISMO:Create new 3-D mosaics of Greenland and Antarctica stripped of their icy cover
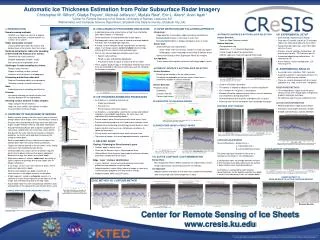
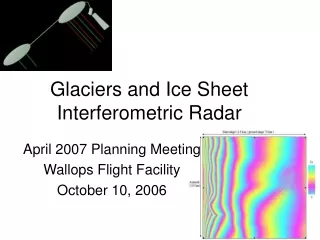
Objectives Develop and test radar systems and algorithms for imaging the base of the polar ice sheets • Investigate interferometric, multiaperture array, and tomographic clutter rejection methods for basal imaging • Develop multiphase center P-band and VHF radars capable of sounding kilometer thick ice and interferometric operations • Assess the requirements for extension to continental scale campaigns
Data Collections • May 2006 (twin otter platform & KU’s ice sounding radar) • 150 MHz (VHF) with 20 MHz bandwidth, in western Greenland • September 2007 (P3 platform & KU’s ice sounding radar) • 150 MHz data with 20 MHz bandwidth • 450 MHz data with 30 MHz bandwidth
Radar Power Amplifiers (upper left); Radar control unit, receivers, and test equipment (right)
GISMO Navigation Performance and Motion Files for September 2007
SAR image of May 2006 Flight,150 MHz Western Greenland Ice Sheet base 25 km surface internal layers 5.8 km in the air
May 2006 GISMO Interferogram 5.8 km 25 km 150 MHz 3.9 m baseline
Left-Right separation: Phase Gradient S1 S2 x B r1 H r1 r2, right r2, left P Q h(x) Cross terms neglected but these could be important
Left/right side interferogram separation Left side interferogram Right side interferogram
High elevation Approximation for Thickness B r2 r1 sin1 = n·sin2
May 2006 GISMO Flight, 150 MHz, InSAR Swath Measurements of Topography Beneath the Greenland Ice Sheet Basal topography measured along a 25 km flight line and across a 3 km swath over the western Greenland Ice Sheet in May 2006. Thickness was measured using an airborne 150 MHz Synthetic Aperture Radar. The data were processed to simultaneously image the left and right sides of the aircraft. Thickness was subtracted from ICEsat surface elevation data to compute basal topography. left right
September 2007 GISMO flight with 450 MHz 5.8 km in the air 19 km base surface
450 MHz GISMO interferogram 19 km 1.3 m baseline 1 km in air
Depth Sounder mode data: Filtered Interferogram largely one-sided September 2007 450 MHz GISMO Data Collection
GISMO: Short Term Plans • Conduct a third experiment in May, 2008 • Develop better multi-look processing schemes • Re-assess technical requirements on radar performance and platform
GISMO: Long Term Plans • 3-Year IIP activity demonstrated capability to collect 2-d images of the bed and construct 3-d basal topography from aircraft. • Opportunity for further technical development includes increased bandwidth and increased power. ESTO has encouraged a new IIP proposal which would continue the NASA/NSF collaboration. • The next science step is to acquire regional, glaciological data during the IPY, for example, reflectivity and topography maps of the base of the North East Ice Stream. • Next decade – to develop operational instrument and processing capability to construct image and topography mosaics of Greenland and Antarctica stripped of the overlying ice.