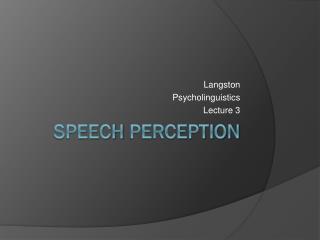
Reading & Speech Perception
Reading & Speech Perception. Connectionist Approach. E.g., Seidenberg and McClelland (1989) and Plaut (1996). Central to these models is the absence of any lexicon . Instead, rely on distributed representations

Reading & Speech Perception
E N D
Presentation Transcript
Connectionist Approach • E.g., Seidenberg and McClelland (1989) and Plaut (1996). • Central to these models is the absence of any lexicon. Instead, rely on distributed representations • The model has no stored information about words and ‘… knowledge of words is encoded in the connections in the network.’
Context Grammar pragmatics Semantics meaning Semantic pathway Orthography print Phonology speech Phonological pathway Connectionist framework for lexical processing, adapted from Seidenberg and McClelland (1989) and Plaut et al (1996).
Plaut et al. (1996) Orthography print th i ck Graphemes(input) Hidden units Phonemes (output) Phonology speech /th/ /ih/ /k/
Plaut et al. (1996) Simulations • Network learned from 3000 written-spoken word pairs by backpropagation. Performance of the network closely resembled that of adult readers • Predictions: • Irregular slower than regular: RT( Pint ) > RT( Pond ) • Frequency effect: RT( Cottage ) > RT( House ) • Consistentency effects for nonwords: RT( MAVE ) > RT( NUST ) • Lesions led to decreases in performance on irregular words, especially low frequency words
Deep Dyslexia: example patient Semantic Errors canoe kayak onion orange window shade paper pencil nail fingernail ache Alka Seltzer Visual Errors fear flag rage race Nonwords: no response substitution of visually similar word (fank -> bank)
Simulations of Deep Dyslexia Semantics meaning Orthography print Phonology speech Next slide only shows this portion of model Plaut and Shallice (1993); Hinton, Plaut and Shallice (1993)
Structure of Model Cleanup units: part of a feedback loop that adjusts the sememe output to match the meaning of words precisely Recurrently connected clean-up units: to capture regularities among sememes Sememe units: one per feature of the meaning Hidden units to allow a non-linear mapping Grapheme units: one unit for each letter/position pair Plaut and Shallice (1993); Hinton, Plaut and Shallice (1993)
Grapheme units: one unit for each letter/position pair Intermediate units: learning (nonlinear) associations between letters and meaning units Sememe (Meaning) units: representation based on semantic features Cleanup units: part of a feedback loop that adjusts the sememe output to match the meaning of words precisely Structure of Model Plaut and Shallice (1993); Hinton, Plaut and Shallice (1993)
What the network learns • Learning was done with back-propagation • The network created semantic attractors: each word meaning is a point in semantic space and has its own basin of attraction. • For a demonstration of attractor networks with visual patterns: http://www.cbu.edu/~pong/ai/hopfield/hopfieldapplet.html • Damage to the sememe or clean-up units can change the boundaries of the attractors. This explains semantic errors. Meanings fall into a neighboring attractor.
Activations of meaning units can be represented in high-dimensional semantic space With network damage, regions of attraction change Semantic Errors: “BED” “COT” Visual Errors: “CAT” “COT” Semantic Space and Effects of Network Damage Plaut and Shallice (1993); Hinton, Plaut and Shallice (1993)
Differences among items that fall into different categories are exaggerated, and differences among items that fall into the same category are minimized. (from Rob Goldstone, Indiana University)
Categorization categorical perception Perceptual Similarity
Some physical continua are perceived continuously E.g.: • Color • Pitch • Loudness • Brightness • Angle • Weight • Etc. Percent “Loud” responses Magnitude of Stimulus (e.g. Loudness) Some are not … Percent responses Magnitude of Stimulus
Examples • from “LAKE” to “RAKE” • http://www.psych.ufl.edu/~white/Cate_per.htm • from /da/ to /ga/ Good /da/ Good /ga/ 1 2 3 4 5 6 7 8
Identification: Discontinuity at Boundary 100% % of /ga/ response 50% 0% 1 2 3 4 5 6 7 8 Token
Pairwise discrimination Good /da/ Good /ga/ 1 2 3 4 5 6 7 8 Discriminate these pairs Discriminate these pairs Discriminate these pairs (straddle the category boundary)
Pairwise Discrimination(same/different) % Correct Discrimination
What Happened? 1 2 3 4 5 6 7 8 Physical World Perceptual Representation 1 2 3 4 5 6 7 8
Categorical Perception • Identification influences discrimination • This an example of how high level cognitive processes (i.e., categorization) can influence perceptual processes
Lexical Identification Shift nonword-word: dask-task word-nonword: dash-tash • Identification experiment • VOT continuum • word at one end, non-word at the other Bias to interpret sounds as words 100 % /d/ 0 short VOT (d) long VOT (t) • Ganong (1980)J. Exp. Psych: HPP 6, 110-125
Phonemic restoration • If a speech sound is replaced by a noise (a cough or a buzz), then listeners think they have heard the speech sound anyway. Furthermore, they cannot tell exactly where the noise was in the utterance. For instance: Auditory presentationPerception Legislature legislatureLegi_lature legi latureLegi*lature legisture It was found that the *eel was on the axle. wheel It was found that the *eel was on the shoe. heel It was found that the *eel was on the orange. peel It was found that the *eel was on the table. meal Warren, R. M. (1970). Perceptual restorations of missing speech sounds. Science, 167, 392-393.
Phoneme monitoring (PM) • Subjects hear words, and have to press a button as soon as they hear a pre-specified target phoneme. Easy form: the target phoneme is always in the same position; Difficult form: the target phoneme can occur anywhere in the words. • Phoneme monitoring is faster in high frequency words than in low frequency words or in nonwords in the easy form. This suggests that there is top-down influence. there are two ways in which we identify phonemes, either via top-down information or via bottom-up information.
TRACE model • Similar to interactive activation model but applied to speech recognition • Connections between levels are bi-directional and excitatory top-down effects • Connections within levels are inhibitory producing competition between alternatives
Phonemes activate word candidates. Candidates compete with each other Winner completes missing phoneme information TRACE model
Phonemes are processed one at a time System activates candidate words that are consistent with current information Candidates compete with each other Winner is selected and competitors are inhibited TRACE model
Effect of Word Frequency on Eye Fixations = bench = bed = bell = lobster “Pick up the bench” lobster bench X bell bed More fixations are directed to high-frequency related distractor than low-frequency distractor Pictures of these objects (Dahan, Magnuson, & Tanenhaus, 2001)