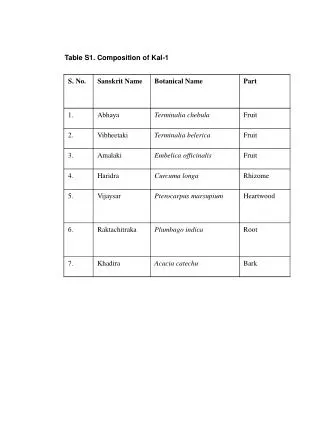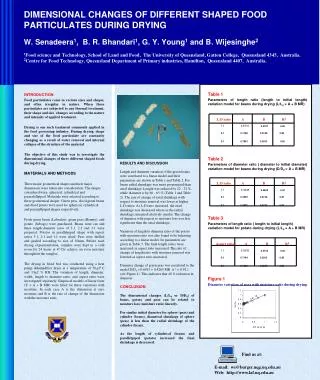
Table 1 Soybean sample composition
Moisture. Protein. Oil. Fiber. Roundup Ready soybeans. Principal Components. Non Roundup Ready soybeans. Detection of Roundup Ready â„¢ Soybeans by Near-Infrared Spectroscopy S.A. Roussel*, C.L. Hardy**, C.R. Hurburgh, Jr.*, G.R. Rippke* Iowa State University, . Ames, IA
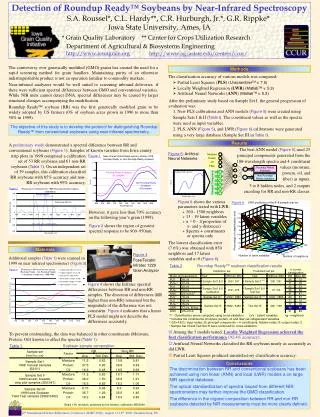

Table 1 Soybean sample composition
E N D
Presentation Transcript
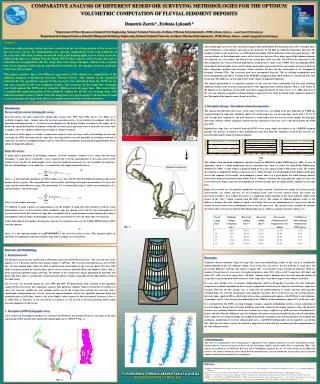
Moisture Protein Oil Fiber Roundup Ready soybeans Principal Components Non Roundup Ready soybeans Detection of Roundup Ready™ Soybeans by Near-Infrared Spectroscopy S.A. Roussel*, C.L. Hardy**, C.R. Hurburgh, Jr.*, G.R. Rippke* Iowa State University,. Ames, IA * Grain Quality Laboratory ** Center for Crops Utilization Research Department of Agricultural & Biosystems Engineering http://www.iowagrain.org http://www.ag.iastate.edu/centers/ccur/ The controversy over genetically modified (GMO) grains has created the need for a rapid screening method for grain handlers. Maintaining purity of an otherwise indistinguishable product is not an operation familiar to commodity markets. Near-infrared analyzers would be well suited to screening inbound deliveries, if there were sufficient spectral differences between GMO and conventional varieties. While NIR units cannot detect DNA, spectral differences may be caused by larger structural changes accompanying the modification. Roundup Ready™ soybean (RR) was the first genetically modified grain to be widely adopted by US farmers (0% of soybean acres grown in 1996 to more than 50% in 1999). Methods • The classification accuracy of various models was compared: • Partial Least Squares (PLS) (UnscramblerTM v. 7.5) • Locally Weighted Regression (LWR) (MatlabTM v. 5.3) • Artificial Neural Networks (ANN) (MatlabTM v. 5.3) • After the preliminary study based on Sample Set I, the general progression of evaluation was: 1. New PLS calibrations and ANN models (Figure 5) were created using Sample Sets I & II (Table I). The constituent values as well as the spectra were used as input variables. 2. PLS, ANN (Figure 5), and LWR (Figure 6) calibrations were generated using a very large database (Sample Set III in Table I). The objective of this study is to develop the protocol for distinguishing Roundup Ready™ from conventional soybeans using near infrared spectrometry. Results A preliminary study demonstrated a spectral difference between RR and conventional soybeans (Figure 1). Samples of known varieties from Iowa county The best ANN model (Figure 5) used 25 principal components generated from the 100-wavelength spectra and 4 constituent Figure 5: Artificial Neural Networks strip plots in 1998 comprised a calibration set of 53 RR soybeans and 61 non-RR soybeans (Table 1). On an independent set of 39 samples, this calibration classified RR soybeans with 85% accuracy and non-RR soybeans with 95% accuracy. Figure 1 values (moisture, protein, oil, and fiber) as inputs, 5 to 8 hidden nodes, and 2 outputs encoding for RR and non-RR classes. • Figure 6 shows the various parameters tested with LWR: • 300 - 1500 neighbors • 13 - 19 latent variables • α = 0 - 1(proportion of x- and y-distances) • Spectra + constituents or spectra only Figure 6 However, it gave less than 70% accuracy on the following year’s grain (1999). Figure 2 shows the region of greatest spectral response to be 900–950nm. The lowest classification error (7.6%) was obtained with 850 neighbors and 17 latent variables and α=0 (Figure 6). Materials Figure 3 Foss/Tecator Infratec 1229 Grain Analyzer Additional samples(Table 1)were scanned in 1999 on near infrared spectrometers(Figure 3). Table 2Roundup Ready™ soybean classification results Figure 4 shows the Infratec spectral differences between RR and non-RR samples. The direction of differences (RR higher than non-RR) remained but the magnitude of the difference was not consistent. Figure 4 indicates that a linear PLS model might not describe the differences accurately. (cv) -Classification errors computed using cross-validation LVs - Latent variables ng - neighbors a Includes the constituents (moisture, protein, oil and fiber) as independent variables b (25+4:8:2): Input nodes: 25 principal components + 4 constituents; hidden nodes: 8; output nodes: 2 c Sample Set III and Test Set III were combined for cross-validation. • Among the 3 models tested, Locally Weighted Regression achieved the best classification performance(92.4% accuracy). • Artificial Neural Networks classified the RR soybeans nearly as accurately as did LWR. • Partial Least Squares produced unsatisfactory classification accuracy. To prevent confounding, the data was balanced in other constituents (Moisture, Protein, Oil) known to affect the spectra (Table 1). Table 1Soybean sample composition The discrimination between RR and conventional soybeans has been achieved using non linear (ANN) and local (LWR) models a on large NIR spectral database. The optical standardization of spectra issued from different NIR spectrometers may further improve the GMO classification. The difference in the organic composition between RR and non-RR soybeans detected by NIR measurements must be more clearly defined. Conclusions Basis 13% moisture, predicted by the Infratec, calibration SB00994 10th International Diffuse Reflectance Conference (IDRC-2000), August 13-18th, 2000, Chambersburg, PA.