Download
1 / 15
150 likes | 415 Vues
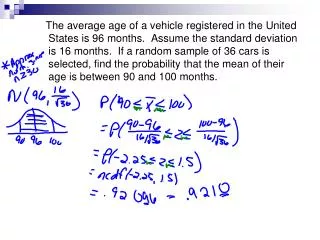
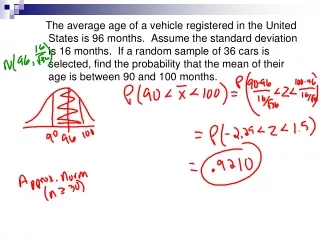
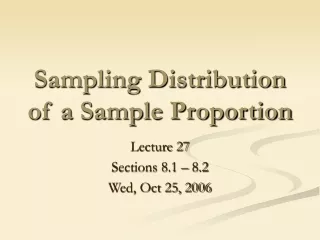
Sampling Distribution of a Sample Proportion. Lecture 26 Sections 8.1 – 8.2 Fri, Oct 12, 2007. Preview of the Central Limit Theorem. We looked at the distribution of the average of 1, 2, and 3 uniform random variables U (0, 1).

E N D
Sampling Distribution of a Sample Proportion Lecture 26 Sections 8.1 – 8.2 Fri, Oct 12, 2007
Preview of the Central Limit Theorem • We looked at the distribution of the average of 1, 2, and 3 uniform random variables U(0, 1). • We saw that the shapes of their distributions was moving towards the shape of the normal distribution.
Preview of the Central Limit Theorem • Some observations: • Each distribution is centered at the same place, ½. • The distributions are being “drawn in” towards the center. • That means that their standard deviation is decreasing. • Can we quantify this?
Preview of the Central Limit Theorem • = ½ 2 = 1/12 2 1 0 1
Preview of the Central Limit Theorem • = ½ 2 = 1/24 2 1 0 1
Preview of the Central Limit Theorem • = ½ 2 = 1/36 2 1 0 1
Preview of the Central Limit Theorem • This tells us that a mean based on three observations is much more likely to be close to the population mean than is a mean based on only one or two observations.
Parameters and Statistics • THE PURPOSE OF A SAMPLE STATISTIC IS TO ESTIMATE A POPULATION PARAMETER. • A sample mean is used to estimate the population mean. • A sample proportion is used to estimate the population proportion.
Parameters and Statistics • Sample statistics are variable. • Population parameters are fixed.
Some Questions • We hope that the sample proportion is close to the population proportion. • How close can we expect it to be? • Would it be worth it to collect a larger sample? • If the sample were larger, we would expect the sample proportion to be closer to the population proportion. • How much closer? And how much larger?
Experiment • Survey finds drop in hand hygiene