Download
1 / 31
310 likes | 433 Vues
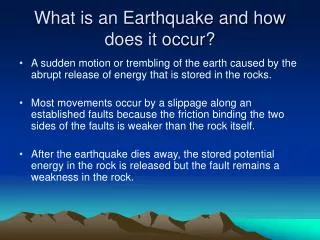
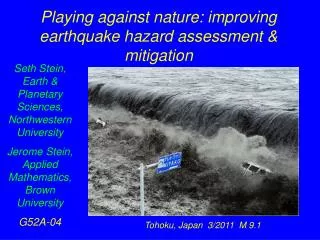
Playing against nature: improving earthquake hazard assessment & mitigation. Seth Stein, Earth & Planetary Sciences, Northwestern University Jerome Stein, Applied Mathematics, Brown University G52A-04. Tohoku, Japan 3/2011 M 9.1. Japan spent lots of effort on national hazard map, but

E N D
Playing against nature: improving earthquake hazard assessment & mitigation Seth Stein, Earth & Planetary Sciences, Northwestern University Jerome Stein, Applied Mathematics, Brown University G52A-04 Tohoku, Japan 3/2011 M 9.1
Japan spent lots of effort on national hazard map, but 2011 M 9.1 Tohoku, 1995 Kobe M 7.3 & others in areas mapped as low hazard In contrast: map assumed high hazard in Tokai “gap” Geller 2011
Tohoku earthquake broke many segments 2011 Tohoku Earthquake 450 km long fault, M 9.1 Expected Earthquake Sources 50 to 150 km segments M7.5 to 8.2 (Headquarters for Earthquake Research Promotion) (Aftershock map from USGS) J. Mori
Mitigation planning assumed maximum magnitude 8 Seawalls 5-10 m high Stein & Okal, 2011 NYT Tsunami runup approximately twice fault slip (Plafker, Okal & Synolakis 2004) M9 generates much larger tsunami CNN
Expensive seawalls - longer than Great Wall of China -proved ineffective 180/300 km swept away or destroyed In some cases discouraged evacuation NY Times 3/31/2011
Earthquakes prior to the 2008 Wenchuan event Aftershocks of the Wenchuan event delineating the rupture zone 2008 Wenchuan earthquake (Mw 7.9) was not expected: map showed low hazard based on lack of recent earthquakes Didn’t use GPS data showing 1-2 mm/yr (~Wasatch) Stein et al., 2012
2010 M7 earthquake shaking much greater than predicted for next 500 years Haiti 2001 hazard map http://www.oas.org/cdmp/document/seismap/haiti_dr.htm Map didn’t use GPS data
Similar problems occur worldwide The earth often surprises us Do these reflect systemic problems with hazard mapping or simply low probability events (someone wins the lottery)? How can we do better at assessing hazards and mitigating them?
Choosing mitigation policy involves hazard assessment, economics, politics Too expensive to rebuild for 2011 sized tsunami >100 $B for new defenses only slightly higher than old ones “In 30 years there might be nothing left there but fancy breakwaters and empty houses.” NY Times 11/2/2011
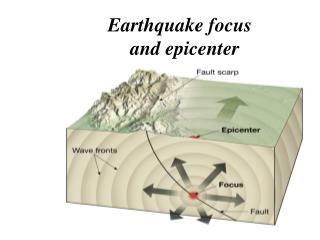
Hazard maps are hard to get right: successfully predicting future shaking depends on accuracy of four assumptions over 500-2500 years Where will large earthquakes occur? When will they occur? How large will they be? How strong will their shaking be? Uncertainty & possible map failure result because these are often hard to assess, especially in plate interiors & other slowly deforming zones
Plate B Earthquakes at different time Plate A • Plate Boundary Earthquakes • Major fault loaded rapidly at constant rate • Earthquakes spatially focused & temporally quasi-periodic • Past is fair predictor • Intraplate Earthquakes • Tectonic loading collectively accommodated by a complex system of interacting faults • Loading rate on a given fault is slow & may not be constant • Earthquakes can cluster on a fault for a while then shift • Past can be poor predictor Stein, Liu & Wang 2009
Earthquakes in North China during the period prior to the period instrumental events Large events often pop up where there was little seismicity! Liu, Stein & Wang 2011 Beijing Bohai Bay Ordos Plateau Shanxi Graben 1303 Hongtong M 8.0 Weihi rift
Earthquakes in North China during the period prior to the period instrumental events Large events often pop up where there was little seismicity! Liu, Stein & Wang 2011 Beijing Bohai Bay Ordos Plateau Shanxi Graben Weihi rift 1556 Huaxian M 8.3
Earthquakes in North China during the period prior to the period instrumental events Large events often pop up where there was little seismicity! Liu, Stein & Wang 2011 Beijing Bohai Bay Ordos Plateau Shanxi Graben Weihi rift 1668 Tancheng M 8.5
Earthquakes in North China during the period prior to the period instrumental events Large events often pop up where there was little seismicity! Liu, Stein & Wang 2011 1679 Sanhe M 8.0 Beijing Bohai Bay Ordos Plateau Shanxi Graben Weihi rift
Earthquakes in North China during the period prior to the period instrumental events Large events often pop up where there was little seismicity! Liu, Stein & Wang 2011 1975 Haicheng M 7.3 Beijing Bohai Bay 1976 Tangshan M 7.8 Ordos Plateau Shanxi Graben 1966 Xingtai M 7.2 Weihi rift
Historical Instrumental No large (M>7) events ruptured the same fault segment twice in past 2000 years Shanxi Graben Weihi rift In past 200 years, quakes migrated from Shanxi Graben to N. China Plain
Hazard maps involve assumptions about • - Mmax of largest future events • Ground motion model • Timing of future earthquakes (time-independent or time-dependent) • Since all have large uncertainties, wide range of plausible hazard models 180% 275% Newman et al., 2001
Hazard maps involve assumptions about • - Mmax of largest future events • Ground motion model • Timing of future earthquakes (time-independent or time-dependent) • Since all have large uncertainties, wide range of plausible hazard models %106 154%
Uncertainty typically factor of 3-4 Often can’t be reduced much due to earthquake variability Hazard is essentially unknowable within broad range One can chose a particular value depending on preconception, but the uncertainty remains and only time will tell how good the choice was Stein et al, 2012 Stein et al., 2012
Seismological assessment of hazard maps Various metrics could be used, e.g. compare maximum observed shaking in subregion i, xi to predicted maximum shaking pi Compute Hazard Map Error HME(p,x) = i (xi - pi)2/N and compare to error of reference map produced using a null hypothesis HME(r,x) = i (xi - ri)2/N using the skill score SS(p,r,x) = 1 - HME(p,x)/HME(r,x) Positive score if map does better than null
Some testing challenges Short time record: can be worked around by aggregating regions. 2) Subjective nature of hazard mapping, resulting from need to chose faults, maximum magnitude, recurrence model, and ground motion model. This precludes the traditional method of developing a model from the first part of a time series and testing how well it does in the later part. That works if the model is "automatically" generated by some rules (e.g. least squares, etc). In the earthquake case, this can't be done easily because we know what happens in the later part of the series.
3) New maps made after a large earthquake that earlier maps missed are problem for counting statistics. Before 2010 Haiti M7 After 2010 Haiti M7 4X Frankel et al, 2010
4) Overparameterized model (overfit data):Given a trend with scatter, fitting a higher order polynomial can givea better fit to the past data but a worse fit to future dataAnalogously, a seismic hazard map fit to details of past earthquakes could be a worse predictor of futureones than a smoothed mapHow much detail is useful? Linear fit Quadratic fit
Societal assessment of hazard maps Consider map as means, not end Assess map’s success in terms of contribution to mitigation Even uncertain or poor maps may do some good
Societally optimal level of mitigation minimizes total cost = sum of mitigation cost + expected loss Expected loss = ∑ (loss in ith expected event x assumed probability of that event) For earthquake, mitigation level is construction code Loss depends on earthquake & mitigation level Compared to optimum Less mitigation decreases construction costs but increases expected loss and thus total cost More mitigation gives less expected loss but higher total cost Optimum Stein & Stein, 2012
Loss estimate scenarios based on hazard model Estimate loss as function of magnitude, ground shaking model, recurrence rate, and mitigation level This case Current mitigation 10-100 fatalities ~ $100B damage Examine range of parameters & use to find optimum http://earthquake.usgs.gov/earthquakes/eqarchives/poster/2011/20110516.php
Present Value of Future Losses Expected average loss over T years is LT Interest rate i PVFL = LTt 1/(1+i)t = LT DT DT = 1/(1+i)+ 1/(1+i)2 + ... + 1/(1+i)T = ((1+i)T -1) / (i(1+i)T) ≈ 1/i for T large For interest rate i=0.05, DT =15.4for 30years, and 19.8 for 100 years. For long enough times, the limit as T becomes infinite is DT = 1 / I, so if i = 0.05, D = 20. This is essentially the same as the value for 100 years.
Even without uncertainty, mitigation rarely will be optimal for societal reasons,but can still do some good Net benefit when mitigation lowers total cost below that of no mitigation Net loss when mitigation raises total cost above that of no mitigation
Within range, inaccurate hazard maps produce nonoptimal mitigation, raising cost, but still do some good (net benefit) Inaccurate loss estimates have same effect
Summary Limitations in our knowledge about earthquakes, notably space-time variability, limit how accurately hazard maps can be made Although uncertain maps likely produce nonoptimal mitigation, they still do some good if they’re not too bad Testing maps & quantifying uncertainties will help some Need to recognize & accept uncertainties