Download
1 / 40
400 likes | 547 Vues
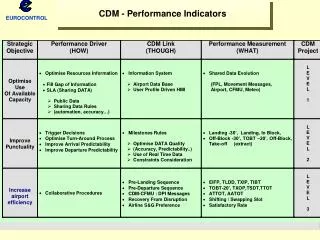
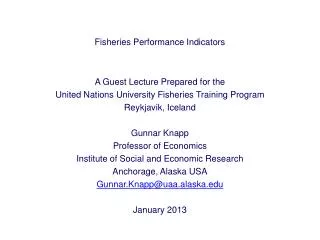
Fisheries Performance Indicators. A Guest Lecture Prepared for the United Nations University Fisheries Training Program Reykjavik, Iceland Gunnar Knapp Professor of Economics Institute of Social and Economic Research Anchorage, Alaska USA Gunnar.Knapp@uaa.alaska.edu January 2013.

E N D
Fisheries Performance Indicators A Guest Lecture Prepared for the United Nations University Fisheries Training Program Reykjavik, Iceland Gunnar Knapp Professor of Economics Institute of Social and Economic Research Anchorage, Alaska USA Gunnar.Knapp@uaa.alaska.edu January 2013
How can we MEASURE how well a fishery is managedand how well it is doing?
How can we MEASURE how well a fishery is managedand how well it is doing?This is not an easy question!!! • Fisheries are managed for multiple objectives. • We need multiple measures • Fisheries may be performing well by some measures and poorly by other measures • How should we “average” different measures? • Collecting and analyzing fisheries data is expensive and takes time • particularly if the data need to be comparable between fisheries and countries! • What measures are needed—and how detailed and reliable they need to be—depends on how we plan to use them.
My goal for this lecture . . . • To get you to think about the problem of designing fishery performance indicators • To describe an ongoing project to develop fishery performance indicators • To have you evaluate a fishery you are familiar with according to these performance indicators • To critique these performance indicators: • What is good about them? • What is bad about them? • How would you change them?
The “Fisheries Performance Indicators” (FPI) Project . . . • Objective is to develop simple, practical and useful “fisheries performance indicators” (FPIs) which: • Provide useful indicators of the performance of a fishery with respect to multiple objectives • Can be developed for any kind of fishery in any country • Are comparable across fisheries and countries • Can be used to analyze how different factors affect fishery success • Information can be developed easily, quickly, and at low cost by one or a few fishery specialists • Are easy to understand and work with • Designed by three economists • James L. Anderson (World Bank) • Jingie Chu (World Bank) • Chris Anderson (University of Washington) • Tested by about thirty fishery specialists for fisheries in many developed and developing countries
On a piece of paper please write: Your name (or alias) Your country The name of a fishery in your country you will attempt to evaluate using some of the fishery performance indicators
Your name: ________________ Your country: __________________Fishery which you attempted to evaluate using selected “fishery performance indicators”: ________________________________________________________
Output performance indicator:Overfishing or Rebuilding • Stock is not overfished or is rebuilt • Growth overfished, but stable or rebuilding • Growth overfished and experiencing growth overfishing • Recruit overfished, but stable or rebuilding • Recruit overfished and experiencing recruit overfishing
How well did you understand what this indicator was asking for? • I understood exactly what it was asking for • I understood fairly well what it was asking for • I had only a vague understanding of what it was asking for • I didn’t understand at all what it was asking for Mean = 1.95
How easy or difficult for you was it to assign a value for this indicator? • Very easy • Somewhat easy • Somewhat hard • Very hard Mean = 2.00
Output performance indicator:Boat owners fishery wages compared to non-fishery wages • More than 50% above the regional average • Between 10 and 50% above regional average • Within 10% above the regional average • Between 50% and 90% of the regional average • Less than half of the regional average
How well did you understand what this indicator was asking for? • I understood exactly what it was asking for • I understood fairly well what it was asking for • I had only a vague understanding of what it was asking for • I didn’t understand at all what it was asking for Mean = 1.57
How easy or difficult for you was it to assign a value for this indicator? • Very easy • Somewhat easy • Somewhat hard • Very hard Mean = 1.95
Output performance indicator:International trade • 90-100% export • 60-90% export • 30-60% export • 2-30% export • Virtually no export
How well did you understand what this indicator was asking for? • I understood exactly what it was asking for • I understood fairly well what it was asking for • I had only a vague understanding of what it was asking for • I didn’t understand at all what it was asking for Mean = 1.87
How easy or difficult for you was it to assign a value for this indicator? • Very easy • Somewhat easy • Somewhat hard • Very hard Mean = 1.76
Output performance indicator:Social standing of boat owners • Among the most respected in the community, comparable with civic and religious leaders and professionals such as doctors and lawyers • Comparable to management and white collar jobs • Comparable to skilled labor jobs • Comparable to unskilled blue collar or service jobs • Among the least respected, such as slaves or indentured servants
How well did you understand what this indicator was asking for? • I understood exactly what it was asking for • I understood fairly well what it was asking for • I had only a vague understanding of what it was asking for • I didn’t understand at all what it was asking for Mean = 1.96
How easy or difficult for you was it to assign a value for this indicator? • Very easy • Somewhat easy • Somewhat hard • Very hard Mean = 2.04
Output performance indicator:Landings Level • Harvest is less than MSY (stock is above MSY level) • Harvest is approximately at MSY • Harvest reduced to promote recovery (stock is below MEY level) • Harvest is constraining stock recovery (stock is stable below MEY level) • Harvest is causing overfishing (stock is below MEY and declining)
How well did you understand what this indicator was asking for? • I understood exactly what it was asking for • I understood fairly well what it was asking for • I had only a vague understanding of what it was asking for • I didn’t understand at all what it was asking for Mean =
How easy or difficult for you was it to assign a value for this indicator? • Very easy • Somewhat easy • Somewhat hard • Very hard Mean =
Output performance indicator:Harvest Safety • Less than 0.1 deaths per thousand person seasons • Less than 0.5 deaths • Less than 1 • Less than 5 • More than 5 deaths per thousand person seasons
Output performance indicator:Harvest Safety • Less than 0.1 deaths per thousand person seasons • Less than 0.5 deaths • Less than 1 • Less than 5 • More than 5 deaths per thousand person seasons
How well did you understand what this indicator was asking for? • I understood exactly what it was asking for • I understood fairly well what it was asking for • I had only a vague understanding of what it was asking for • I didn’t understand at all what it was asking for Mean =
Output performance indicator:Source of capital • Unsecured business loans from banks/Venture capital • Secured business loans from banks/Public stock offering; investment form elsewhere in supply chain • Loans form banks secured by personal (not business) assets/Government subsidized private lending/Government-run loan programs/International aid agencies; secured loans from elsewhere in supply chain • Microlending/Family/community-based lending; loans from supply chain significantly reduce margins • Mafia/No capital available; exploitive relationship from elsewhere in supply chain
Output performance indicator:Harvest Safety • Less than 0.1 deaths per thousand person seasons • Less than 0.5 deaths • Less than 1 • Less than 5 • More than 5 deaths per thousand person seasons
How well did you understand what this indicator was asking for? • I understood exactly what it was asking for • I understood fairly well what it was asking for • I had only a vague understanding of what it was asking for • I didn’t understand at all what it was asking for Mean =
Output performance indicator:Proportion of Harvest Managed Under Limited Access • Virtually all • 70-90% • 35-70% • 5-35% • Virtually none
Output performance indicator:Harvest Safety • Less than 0.1 deaths per thousand person seasons • Less than 0.5 deaths • Less than 1 • Less than 5 • More than 5 deaths per thousand person seasons
How well did you understand what this indicator was asking for? • I understood exactly what it was asking for • I understood fairly well what it was asking for • I had only a vague understanding of what it was asking for • I didn’t understand at all what it was asking for Mean =
How useful is this Fisheries Performance Indicator Project • Very useful • Somewhat useful • Not very useful • A total waste of money and time! Mean = 2.52