Energy Performance Indicators
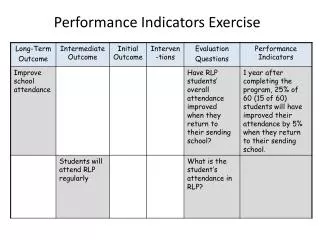
Energy Performance Indicators. Liam Tolton Second Sight Technical. Topics. Energy Performance Indicators What are they ? How to Develop your own EPIs Getting the best use from your EPIs Workshop Plan your EPI Development.

Energy Performance Indicators
E N D
Presentation Transcript
Energy Performance Indicators Liam Tolton Second Sight Technical
Topics • Energy Performance Indicators • What are they ? • How to Develop your own EPIs • Getting the best use from your EPIs • Workshop • Plan your EPI Development
Introduction to Energy Performance Indicators (EPIs)Step 17 Monitor • What is an EPI ? • A means of Comparison of Performance versus a standard • Internal EPI • e.g. compare one machine or line against another • External EPI • Compare two sites against each other • Compare sites against a Best Practice Site • Compare sites against a selection of similar sites.
Developing your own EPIsStep 17 Monitor • Each site is DIFFERENT • However, • Most sites can develop OVERALL SITE EPIs • Units of Energy per Unit of product • e.g. kWhrs / Tonne of Product • kWrs / unit of product produced • (If all products are the same) • The EPI is a good measure of ENERGY INTENSITY
What does a good EPI Depend on ? • DATA • A good measure of your overall consumption • A good measure of your output • This may not be as easy as it sounds….. • Overall Consumption • From Energy Bills….. • Overall Production • From Production Manager….
Let’s look at both of these.. • The Energy Bill • Electricity : Meter Reading Dates can vary…. • Gas: Meter reading dates can vary… • Oil : Deliveries dates / oil stock levels can vary… • The Production Output • This information may be gathered WEEKLY… • The Shift Pattern can vary… • The Product Mix can vary… • NOT So Simple after all……
What can we do ? • STANDARDISE as much as possible • Time Interval Determination • Decide on • Calendar Month ? • Every 4 weeks ? • Weekly ? • Stick with this approach • Ensures Consistency in the Long Run
Reading your own MetersStep 18 Measuring • Learn How to Read YOUR Meter • Find out where the main meter is located • Find out if there is any Sub Metering on • Buildings • Processes • Equipment • Know your METER FACTOR (multiplier) Gather ALL information from the meter • Reactive Power & Maximum Demand • Can be done Manually but On Line is Better • Watch for Meter Overrun …..
Decide the Time Interval • Weekly • At the end of Production Period • Again at the Start of the Next Period • This allows you to work out FIXED / VARIABLE Split • Monthly • On the same day as the ESB Meters are read • Try to do it at the same time if possible
Determining the Production OutputStep 18 Measuring • Ask the Production Manager ….. • Prompt the additional questions • Was the product mix similar to last period? • Were there any unusual interruptions? • Did the Shift Pattern Change ? • Was there a holiday period ? • Was there a Plant Shutdown ? • This information helps you explain changes
Calculating your EPI • Simplest way is to set up aspreadsheet to • Input Meter Readings • Input Production Data • Calculate the EPI • Portray the EPI graphically over time • Add some sophistication • Include Energy Prices • Calculate and Average Energy Cost
Graphical Portrayal • Advantages • Clear Representation of Progress • Trends can be seen immediately • Corrective Action can be taken immediately • Effects of Corrective Action should be clear • May be posted on notice boards • The COMMUNICATION of this Information is Very Important
Getting the Most from your EPI • Best Practice • Usually an External Comparator • Relies on independent accurate assessment of best practice sites • Past Performance • Usually an Internal Comparator • Relies on gathering good measurement data for comparison
Overall Site EPI • An overall site EPI is very useful • Keep it Simple • Ensure it is easily measured • Communicate it to everyone on site • The Simplest EPIs are: • Units of Energy per unit of Output • Cost of Energy per unit of Output • Can be used in your ELEVATOR SPEECH
What do you do with your EPI ?Step 19 Review • Communicate them …. • To Management as part of a Regular Energy Report • To Staff via Notice boards • Use them for Benchmarking • Compare to other sites • Compare to Industry Surveys • Annual Energy Budget • Compare to Annual Energy Budget • Set Targets for Site Wide Energy Reduction
How do YOU compare ? • European Benchmarking Survey • European Plastics Industry • April to September 2005 • Energy Consumption • Energy Awareness • Ref: Low Energy Plastics Processing • Reduced Energy Consumption in Plastics Engineering • European Best Practice Guide • Oct 2006
Results • Energy Consumption • Average Site Specific Energy Consumption (SEC) • 2.87 kW/kg/hr = 2870 kWhrs / tonne • Range 0.63 for compounding to 6.2 for vacuum thermoforming • SEC higher for Small machines • SEC was lower for Electric versus Hydraulic Machines
Management Actions & AwarenessTAKE ACTION PILLAR • Energy Actions • 30 % had a written energy policy • 5 % employed a dedicated Energy Manager • 40 % had used Energy Consultants • 30 % had measured down to machine level • Energy Awareness Score 1 to 16 • 60 % scored < 4 • Only 1 % was in the 14 to 16 range
Summary • The Concept of EPIs • How to Determine your EPI • The Pitfalls in determining your EPI • Using your EPI
Workshop : Plan your EPI Development • The Four Fundamental Planning Questions : • What ? • Who ? • How ? • When ? • The What Question defines the SCOPE • The Who Question defines the TEAM • The How Question defines the METHOD • The When Question defines the SCHEDULE
What & Who ? • Decide WHAT is your optimum EPI ? • Select 2 possible EPIs • Write out the PRO’s • Write out the CON’s • Decide WHO does the following: • Data Gathering (Meter reading) • Set up Spreadsheet • Data Input • EPI Calculation • EPI Checking • Who will see the information ?
How & When • How • How will the data be gathered? • How will it be processed? • How will it be checked? • How will it be publicised • When • When will it be done : Agree DEADLINES • Meter Reading • EPI Calculation • EPI Reporting
What use will be made of the EPI • Monthly Reporting ? • Quarterly Reporting? • Annual Reporting ? • Energy Budget Preparation? • Project Evaluation? • Others?
Take Action ! Technical Liam Tolton info@secondsighttechnical.com Tel: 087 2542969 www.sei.ie/energymap