Download
1 / 22
230 likes | 413 Vues
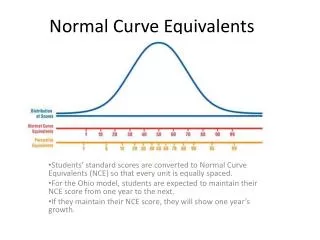
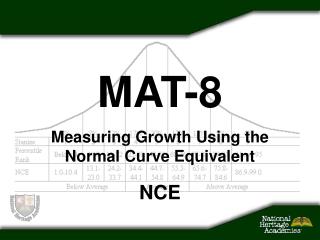
MAT-8. Measuring Growth Using the Normal Curve Equivalent NCE. New Developments. MAT-8 vs. MAT-7 NCEs vs. GEs and NPR’s. National Heritage Academies (NHA) will now be using the Metropolitan Achievement Test, Eighth Edition (MAT 8) with Ready Reports software.

E N D
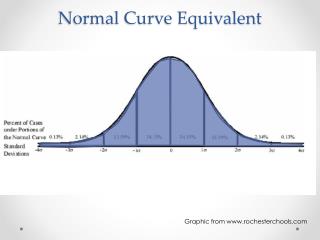
MAT-8 Measuring Growth Using the Normal Curve Equivalent NCE
New Developments • MAT-8 vs. MAT-7 • NCEs vs. GEs and NPR’s National Heritage Academies (NHA) will now be using the Metropolitan Achievement Test, Eighth Edition (MAT 8) with Ready Reports software. This will be the first year NHA will use normal curve equivalents (NCEs) for teacher evaluations instead of grade equivalents (GEs) or national percentiles (NPRs) to measure achievement gains (growth) per class. Grade Equivelents and NPRs will still be used to report test results to parents and the general public.
Choosing Measurements: SS • Why we use Scaled Scores (SS) • They show absolute growth • They precisely measure how much a child’s achievement has changed from one testing period to the next • Issues with Scaled Scores (SS) • They do not show a student’s relative standing within a normative group • They are only relevant to the particular test being administered
Choosing Measurements: NPR • Why we use National Percentile Rank (NPR) • They show relative standing within a normative group • They are easily interpreted • Issues with National Percentile Rank (NPR) • They are non-linear and therefore cannot be used to compute averages
Choosing Measurements: GE • Why we use Grade Equivalent (GE) • They give us a frame of reference that is meaningful • Provides an approximation of student achievement • Issues with Grade Equivalent (GE) • They are often misunderstood • Not the best indicator of absolute growth
Choosing Measurements: NCE • Why we use Normal Curve Equivalent (NCE) • They are linear (given in equal intervals) and therefore they can be used to compute averages and show growth • They reflect relative standing within a normative group • Issues with Normal Curve Equivalent (NCE) • The general public is not familiar with NCEs
Why NCEs? Linear vs. Non-Linear
The Key Indicators SUMMARY: What are you trying to show?
Measuring Growth: • In the past… • Grade Equivalents and NPRs were used to demonstrate growth • For 2001-2002… • NCEs will be used to measure growth
Measuring Growth: • Benefits to Teachers… • Adjustments will be made to take into account initial class standing within the normative group • (Classes will be weighted: Low, Average, High) • NCEs will provide data that can be appropriately averaged and compared • (Provides a more accurate depiction of growth)
Measuring Growth: NCE Growth • What NCE growth looks like… • If growth is… • Equal to “0” = 1 year of growth • GREATER than “0” = more than 1 year of growth • LESS than “0” = less that 1 year of growth
Measuring Growth: Expectations • What we should expect… • We should expect an average of no less than 1 year growth in a classroom • We will reward teachers who achieve 1 year growth and above in their classrooms • Appraisal points will be earned relative to the degree of growth
The Process: Overview Measuring Growth STEP 1: Take PreTest Mean STEP 2: Take PostTest Mean STEP 3: Compare Pre-Test and Post-Test to determine gain or loss STEP 4: Find “level” of PreTest Mean (Low, Average, High) STEP 5: Compare gain or loss to target gain STEP 6: Evaluate teacher based on percentage of target attained
The Process: Gain or Loss Step 1-3 - Determining Gain or Loss… Each class will have an average NCE gain or loss based on its PostTest mean PostTest NCE – PreTest NCE = NCE Gain (or Loss)
The Process: Levels If your PreTest Mean is: Step 4 - Determining Levels… Each class will be assigned to a “level” based on the PreTest Mean (see Table 1) • Each level represents a range of scores based on Mean=50 and SD=3.86 of the sample distribution of means
The Process: Target Gains • Step 5 - Determining Target Gains… • Each class will have a target gain based on the “level” assigned to that class… • Each grade will have different target gains for Low, Average, and High categories (see Table 2) • EXAMPLE: If your class PreTest NCE Mean is “average” (from Table 1) then your class would be compared to the “average” target NCE gain (from Table 2)
The Process: Conversion Step 6 - Converting to Percentage… Each class average is then compared to it’s target gain… Actual NCE Gain/Loss Target NCE Gain = % of Target Attained And a percentage is calculated…
The Process: Teacher Appraisal • Teacher Evaluation… • The calculated percentage is the percent of goal attained • Each teacher will be evaluated based on how close they were able to get their class to the Target Gain… 100%
The Process: Teacher Appraisal Converting to Teacher Appraisal Points The percentage of the expected growth achieved is then converted into teacher evaluation points using the following scale
The Process: Teacher Appraisal Key Teacher Appraisal Key 0 = Below 0% NCE score growth = less than 1 year growth 3 = 0% to 49% NCE score growth = 1 to 1.19 years growth 4 = 50% to 99% NCE score growth = 1.20 to 1.39 years growth 5 = 100% and above NCE growth = 1.4 years growth or greater
The Process: Calculating Points • Calculating Teacher Appraisal Points • See the Interactive Spreadsheet Click Here Select “Enable Macros” when prompted