Contrast Mechanisms in MRI
390 likes | 578 Vues
Contrast Mechanisms in MRI. Introduction to Cardiovascular Engineering Michael Jay Schillaci, PhD Managing Director, Physicist Tuesday, September 16 th , 2008. Overview. Image Acquisition Basic Pulse Sequences Unwrapping K-Space Image Optimization Contrast Mechanisms

Contrast Mechanisms in MRI
E N D
Presentation Transcript
Contrast Mechanisms in MRI Introduction to Cardiovascular Engineering Michael Jay Schillaci, PhD Managing Director, Physicist Tuesday, September 16th, 2008
Overview • Image Acquisition • Basic Pulse Sequences • Unwrapping K-Space • Image Optimization • Contrast Mechanisms • Static and Motion Contrasts • T1 & T2 Weighting, Field Strength, T2*, Dephasing • Endogenous Contrasts • BOLD Imaging • Motion Contrasts • Time of Flight, Diffusion, Perfusion
Image Formation • Integrate magnetization to get MRI signal • Select a z “slice” and form image of XY plane variations • Contrast from difference in magnetization in different tissues • Image at several times to get average Horizontal density Vertical density
Basic MRI Scan Terminology • Orientation: • Coronal • Sagittal • Axial • Matrix Size: • # of Voxels in dimension • Field of view (FOV): • Spatial extent of dimension • Resolution: • FOV/Matrix size. Coronal Sagittal Axial Axial Orientation 64x64 Matrix 192x192mm FOV 3x3mm Resolution Sagittal Orientation 256x256 Matrix 256x256mm FOV 1x1mm Resolution
Image Creation • The scanning process • Protocol sets Gradients and Encodes K-Space Weights • Signal is Determined with Fourier Transform • Image Created with Inverse Transform Step 2 Step 1 Step 3
Image Acquisition Gy varies in each cycle Data Acquisition (DAQ)
Slice Selection Gradient: Gsl • Gradient Field • Ensures Field Greater on “Top” • Larmor Frequency • Depends on z Position • RF pulse • Energizes “Matched” Slice Field Strength Z Position
Frequency Encoding Gradient: Gro • Apply transverse gradient when we wish to acquire image. • Slice emits signal at Larmor frequency, e.g. lines at higher fields will have higher frequency signals. X Position Field Strength
Phase Encoding Gradient: Gpe • Apply Orthogonal RF pulse • Apply before readout • Adjusts the phase along the dimension (usually Y) Y Position Field Strength
Choose phase encoding time so that Unwrapping K-Space Field of View: Pixel Size: Image Adapted from Prof. Yao Wang’s Medical Imaging course notes at: http://eeweb.poly.edu/~yao/EL5823
Maximizing the signal gives the: Ernst Angle: Image Optimization • Adjustment of Flip Angle Parameter • Maximum SNR typically between 30 and 60 degrees • Long TR sequences (2D) • Increase SNR by increasing flip angle • Short TR sequences (TOF & 3D) • Decrease SNR by increasing flip angle
Gradient Echo Imaging • Assume perfect “spoiling” -transverse magnetization is zero before each excitation: • Spin-Lattice (T1) Relaxation occurs between excitations: • Assume steady state is reached during repeat time (TR): • Spoiled gradient rephases the FID signal at echo time (TE):
Spin Echo Imaging • Spin echo sequence applies a 180º “refocusing pulse” • Half way between 90º pulse and DAQ • Allows measurement of true T2 time T2 T2*
Actual Signal 1 T2 Signal T2* 0 0.5 TE 0.5 TE The “Refocusing Pulse” Spins Rotate at Different Rates Refocusing Pulse Re-Aligns Spins
Volume Reconstruction • 3D volumes • composed of 2D slices • Slice thickness. • Thicker slices have more hydrogen so more signal (shorter scan time) • Thinner slices provide higher resolution (longer scan time) • Optional: gap between slices. • Reduces RF interference (SNR) • Fewer slices cover brain 1mm Gap 2mm Thick 3mm
T1 and T2 Weighting • T1 Contrast • Echo at T2 min • Repeat at T1 max • T2 Contrast • Echo at T2 max • Repeat at T1 min • Net Magnetization is T1 Contrast Weighting TR TE Max T1 Contrast Min T2 Contrast T2 Contrast Weighting TR TE Min T1 Contrast Max T2 Contrast
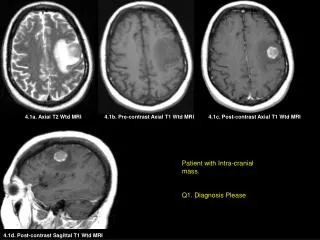
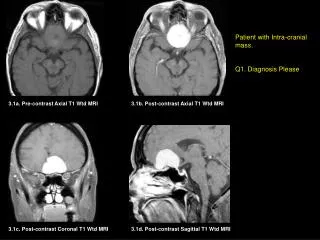
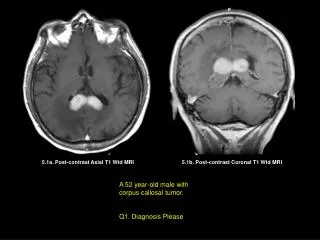
Static Contrast Images • Examples from the Siemens 3T T1 Weighted Image (T1WI) (Gray Matter – White Matter) T2 Weighted Image (T2WI) (Gray Matter – CSF Contrast) “Diagnostic Image” “Anatomical Image”
+z M B0 q MZ +y MXY BC +x Flip Angle Variation • RF Pulse Magnitude Determines Flip Angle • Duration and magnitude are important q Adapted from: http://www.mri.tju.edu/phys-web/1-T1_05_files/frame.htm
Field Strength Effects • Increased field strength • Net magnetization in material is greater • Increased contrast means signal is increased • Image1 resolution is better Muscle Tissue 1MRI adapted from: http://www.mri.tju.edu/phys-web/1-T1_05_files/frame.htm
Tissue Contrast and Dephasing • Dephasing of H2O and Fat • MRI signal is a composite of Fat and H2O signals • H2O and Fat resonate at different frequencies • T1F = 210 ms, T1W = 2000 ms ( T1F > T1W→ fat is brighter) • Relative phase gives TE dependence MF ΦFW MW Parallel ( ΦFW = 0o ) @ TE = 13.42 ms Anti-Parallel (ΦFW = 180o ) @ TE = 15.66 ms
BOLD Imaging • Blood Oxyenation Level Dependent Contrast • dHb is paramagnetic, Hb is less • Susceptibility of blood increases linearly with oxygenation • BOLD subject to T2* criteria • Oxygen is extracted from capillaries • Arteries are fully oxygenated • Venous blood has increased proportion of dHb • Difference between Hb and dHb is greater for veins • Therefore BOLD is result of venous blood changes
Blood flow Metabolism Neuronal activity BOLD signal [dHb] Blood volume Sources of the BOLD Signal BOLD is a very indirect measure of activity…
Neuronal Origins of BOLD BOLD response predicted by dendritic activity (LFPs) Increased neuronal activity results in increased MR (T2*) signal LFP=Local Field Potential; MUA=Multi-Unit Activity;SDF=Spike-Density Function Adapted from Logothetis et al. (2002)
The BOLD Signal ACTIVE BASELINE
BOLD Imaging • Blood Oxyenation Level Dependent Contrast • Susceptibility of blood changes with oxygenation • Blood flow correlated with task performance • Differential activations can be mapped BASELINE ACTIVE
Static Contrast - T2* Relaxation • T2* accounts for magnetic defects and effects • T2 is relaxation due to spin-spin interaction of nuclei • T2M is relaxation induced by inhomogeneities of main magnet • T2MS is relaxation induced by magnetic susceptibility of material
BOLD artifacts • fMRI is a T2* image – we will have all the artifacts that a spin-echo sequence attempts to remove. • Dephasing near air-tissue boundaries (e.g., sinuses) results in signal dropout. BOLD Non-BOLD
Flow Weighting • Time-of-Flight Contrast Acquisition Excitation Saturation No Flow Medium Flow High Flow No Signal Medium Signal High Signal Vessel Vessel Vessel
Diffusion Tensor Imaging ADC Anisotropy • Diffusion Coefficients • Magnitude (ADC) Maps “Proton pools” • Direction (Anisotropy) Maps “Velocity” • Reconstruct Fiber Tracks with “Clustering”
Indices of Diffusion Anisotropy Relative anisotropy: Fractional anisotropy: Vector MD FA
Examine integrity of fiber tracts Tractography - trace white matter paths in gray matter Assess neglect as a disconnection syndrome Healthy DTI in Stroke Research Stroke
Arterial Spin Labeling • Perfusion • Flow of fluid into vessels to supply nutrients/oxygen • The amount and direction of flow matters
Pulsed Labeling Imaging Plane Alternating Inversion Alternating Inversion EPISTAR EPI Signal Targeting with Alternating Radiofrequency FAIR Flow-sensitive Alternating IR
180o 180o 90o RF Gx Image Gy Alternating Proximal Inversion Odd Scan Even Scan Gz 90o 180o 180o RF Gx Image Gy Odd Scan Alternating opposite Distal Inversion Gz Even Scan ASL Pulse Sequences EPI Signal Targeting with Alternating Radiofrequency EPISTAR Flow-sensitive Alternating IR FAIR