ELECTRON ENERGY LOSS SPECTROSCOPY
220 likes | 522 Vues
ELECTRON ENERGY LOSS SPECTROSCOPY. GÖZDE ARIBAL 20823751 AYKUT BİLİR 20823842 BORGA DERBENT 20823966.

ELECTRON ENERGY LOSS SPECTROSCOPY
E N D
Presentation Transcript
ELECTRON ENERGY LOSS SPECTROSCOPY GÖZDE ARIBAL 20823751 AYKUT BİLİR 20823842 BORGA DERBENT 20823966
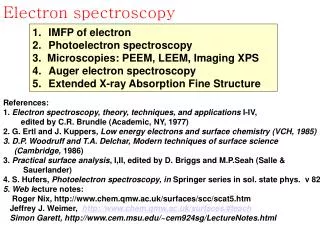
CONTENTS Whatis the EELS ? The process of historical development How does it work ? Components and properties Why is it used ? Advantages and Disadvantages Compare with EDX Applications Summary References
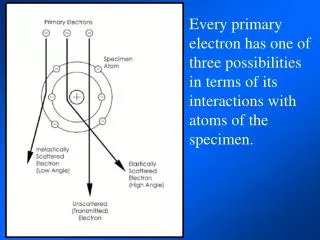
WHAT IS EELS ? Analyticaltechnique Quantitativeanalysis Analysisof the inelastic scattering suffered by the transmitted electron beam with measurement of the electron energy distribution Capableof giving structural and chemical information Electronspectrometer
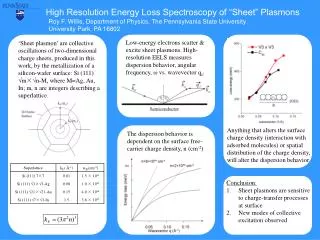
Figure 1 High-resolution electron energy loss spectroscopy (EELS) is a high-sensitivity, non-destructive technique for the study of surface and adsorbate vibrations and low-energy electronic excitations.
THE PROCESS OF HISTORICAL DEVELOPMNET James Hillier RF Baker in the mid 1940s Research1990s due to advance in microscope instrumentations and vacuum technology
HOW DOES IT WORK ? Can be obtainedexperimentally Inelasticscattering of X-ray photonsoropticalmeasurements Change in momentum anddirection of propaganation Change in internaldegrees of freedom
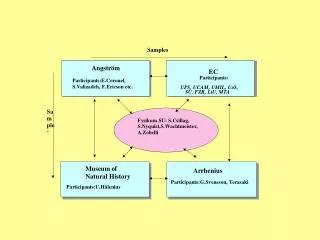
COMPONENTS AND PROPERTIES Magneticfieldis betweentwoparallelplates. Objectiveaperture Specimen Lens Collectoraperture
Figure 3 Photograph of thefirstelectronmicroanalyzer (Hillerand Baker 1944)
WHY IS IT USED ? Themeasurements of Localproperties Includingspecimenthickness Mechanicalandelectronical Chemicalcomposition
ADVANTAGES Highercore-losssignal Higherultimatespatialresolution Absolute, standardlessquantification Structuralinformationavailable
DISADVANTAGES Higherspectral background Verythinspecimenneeded Possibleinaccuracy in crystals Moreoperatorintensive
COMPARE WITH EDX Table 1.Comprasion between EELS and EDX.
Table 2. X-ray fluorescenceyieldfor K-,L- and M- shells as a function of atomicnumber, fromKrause (1979)
APPLICATIONS Thicknessmeasurements Pressuremeasurements Analyticalelectronmicroscopy(AEM)
SUMMARY Electron energy-loss spectroscopy (EELS) is an analytical technique that measures the change in kinetic energy of electrons after they have interacted with a specimen.
REFERENCES Journal de Physique IV , Colloque C7 , supplémentaujournal de physique III ,Volume 3 R.F. EGERTON ElectronEnergyLossSpectroscopyin TheElectronMicroscope 3. Edition Yüksek Lisans Tezi NANO ÖLÇEKLİ VANANYUM OKSİT İNCE FİLMLERİN YAPISAL VE ELEKTRİKSEL KARAKTERİZASYONU Ogeday ÇAPAR