Download
1 / 26
270 likes | 423 Vues
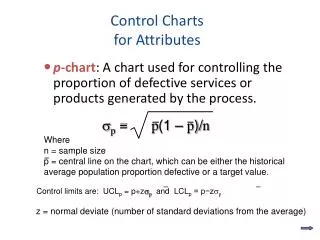
p = p (1 – p )/ n. Where n = sample size p = central line on the chart, which can be either the historical average population proportion defective or a target value. –. –. Control limits are: UCL p = p+z p and LCL p = p−z p. Control Charts for Attributes.

E N D
p = p(1 – p)/n Where n = sample size p = central line on the chart, which can be either the historical average population proportion defective or a target value. – – Control limits are: UCLp = p+zp and LCLp = p−zp Control Charts for Attributes • p-chart: A chart used for controlling the proportion of defective services or products generated by the process. z = normal deviate (number of standard deviations from the average)
Hometown Bank Example The operations manager of the booking services department of Hometown Bank is concerned about the number of wrong customer account numbers recorded by Hometown personnel. Each week a random sample of 2,500 deposits is taken, and the number of incorrect account numbers is recorded. The results for the past 12 weeks are shown in the following table. Is the booking process out of statistical control? Use three-sigma control limits.
Sample Wrong Proportion Number Account # Defective 1 15 0.006 2 12 0.0048 3 19 0.0076 4 2 0.0008 5 19 0.0076 6 4 0.0016 7 24 0.0096 8 7 0.0028 9 10 0.004 10 17 0.0068 11 15 0.006 12 3 0.0012 Total 147 = 0.0049 147 12(2500) p = p = p(1 – p)/n p = 0.0049(1 – 0.0049)/2500 p = 0.0014 UCLp = 0.0049 + 3(0.0014) = 0.0091 LCLp = 0.0049 – 3(0.0014) = 0.0007 Hometown Bank Using a p-Chart to monitor a process n = 2500
Hometown Bank Using a p-Chart to monitor a process Example
Control Charts Two types of error are possible with control charts • A type I error occurs when a process is thought to be out of control when in fact it is not • A type II error occurs when a process is thought to be in control when it is actually out of statistical control These errors can be controlled by the choice of control limits
Process Capability • Process capability is the ability of the process to meet the design specifications for a service or product. • Nominal value is a target for design specifications. • Tolerance is an allowance above or below the nominal value.
Nominal value Process distribution Lower specification Upper specification 20 25 30 Process Capability Process is capable
Nominal value Process distribution Lower specification Upper specification 20 25 30 Process Capability Process is not capable
Upper specification - Lower specification 6 Cp = Process Capability Ratio, Cp Process capability ratio, Cp, is the tolerance width divided by 6 standard deviations (process variability).
= x – Lower specification 3s = Upper specification – x 3s Cpk = Minimum of , Process Capability Index, Cpk Process Capability Index, Cpk, is an index that measures the potential for a process to generate defective outputs relative to either upper or lower specifications. We take the minimum of the two ratios because it gives the worst-case situation.
Intensive Care Lab Example The intensive care unit lab process has an average turnaround time of 26.2 minutes and a standard deviation of 1.35 minutes. The nominal value for this service is 25 minutes with an upper specification limit of 30 minutes and a lower specification limit of 20 minutes. The administrator of the lab wants to have three-sigma performance for her lab. Is the lab process capable of this level of performance? Upper specification = 30 minutes Lower specification = 20 minutes Average service = 26.2 minutes = 1.35 minutes
= = x – Lower specification 3s Upper specification – x 3s Cpk = Minimum of , Cpk = Minimum of Cpk = Minimum of 1.53, 0.94 26.2 – 20.0 3(1.35) , Process Capability Index 30.0 – 26.2 3(1.35) = 0.94 Intensive Care Lab Assessing Process Capability Example Upper specification = 30 minutes Lower specification = 20 minutes Average service = 26.2 minutes = 1.35 minutes
30 - 20 6(1.35) Process Capability Ratio Cp = = 1.23 Upper specification - Lower specification 6 Cp = Intensive Care Lab Assessing Process Capability Example Does not meet 3 (1.00 Cpk) target due to a shift in mean (Note variability is ok since Cp is over 1.0) Before Process Modification Upper specification = 30.0 minutes Lower specification = 20.0 minutes Average service = 26.2 minutes = 1.35 minutes Cpk= 0.94Cp = 1.23
Nominal value Six sigma Four sigma Two sigma Lower specification Upper specification Mean Effects of Reducing Variability on Process Capability
Six Sigma • 3.4 defects per million • Cpk = 2 • Impact of number of parts or production steps on yield: • 6 sigma 4 sigma 3 sigma • 1 100% 99% 99% • 5 100% 97% 71% • 10 100% 94% 50% • 100 99.97% 54% 0%
Designing in 6-sigma • Reduce the number of parts in a product • Reduce the number of steps in a process
Six Sigma • Six Sigma is a comprehensive and flexible system for achieving, sustaining, and maximizing business success by minimizing defects and variability in processes. • It relies heavily on the principles and tools of TQM. • It is driven by a close understanding of customer needs; the disciplined use of facts, data, and statistical analysis; and diligent attention to managing, improving, and reinventing business processes.
Six Sigma Improvement Model Define Determine the current process characteristics critical to customer satisfaction and identify any gaps. Measure Quantify the work the process does that affects the gap. Analyze Use data on measures to perform process analysis. Improve Modify or redesign existing methods to meet the new performance objectives. Control Monitor the process to make sure high performance levels are maintained.
Six Sigma Implementation • Top Down Commitment from corporate leaders. • Measurement Systems to Track Progress • Tough Goal Setting through benchmarking best-in-class companies. • Education: Employees must be trained in the “whys” and “how-tos” of quality. • Communication: Successes are as important to understanding as failures. • Customer Priorities: Never lose sight of the customer’s priorities.
Six Sigma Education • Green Belt: An employee who achieved the first level of training in a Six Sigma program and spends part of his or her time teaching and helping teams with their projects. • Black Belt: An employee who reached the highest level of training in a Six Sigma program and spends all of his or her time teaching and leading teams involved in Six Sigma projects. • Master Black Belt: Full-time teachers and mentors to several black belts.
ISO 9000 A set of standards governing documentation of a quality program. Documentation standards that require participating companies to keep track of their raw materials use and their generation, treatment, and disposal of hazardous wastes. ISO 14000 International Quality Documentation Standards
Malcolm Baldrige National Quality Award Named after the late secretary of commerce, a strong proponent of enhancing quality as a means of reducing the trade deficit. The award promotes, recognizes, and publicizes quality strategies and achievements. Category 1 ─ Leadership 120 points Category 2 ─ Strategic Planning 85 points Category 3 ─ Customer and Market Focus 85 points Category 4 ─ Measurement, Analysis, and Knowledge Management 90 points 5. Category 5 ─ Human Resource Focus 85 points 6. Category 6 ─ Process Management 85 points 7. Category 7 ─ Business Results 450 points