Download
1 / 6
90 likes | 478 Vues
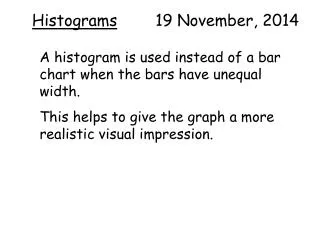
Histograms 19 November, 2014. A histogram is used instead of a bar chart when the bars have unequal width. This helps to give the graph a more realistic visual impression. Why is the bar chart misleading?. Fish Caught. Time (Hours).

E N D
Histograms19 November, 2014 A histogram is used instead of a bar chart when the bars have unequal width. This helps to give the graph a more realistic visual impression.
Why is the bar chart misleading? Fish Caught Time (Hours)
An angler keeps a record of the number of fish caught. The angler puts this information onto a bar chart.
The areas of the bars give a false impression To avoid this problem a histogram is used Fish Caught Time (Hours)
Frequency Density of Fish Caught Time (Hours)
Frequency = Freq. Density x Class Width • Freq. Density = Frequency ÷ Width • Width = Frequency ÷ Freq. Density Here are the results for another angler’s fishing catch F W Calculate the frequency densities for the data in this table and draw a histogram for the data FD