cAMP Treatment: Proteins and Transcripts Overlap
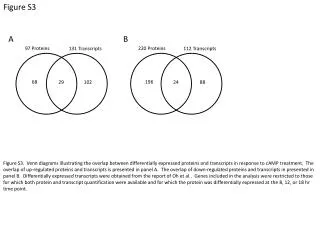
Venn diagrams showing overlap of differentially expressed proteins and transcripts in response to cAMP treatment. Up-regulated and down-regulated proteins/transcripts presented in panels A and B. Analysis restricted to genes with quantification data and differential expression at specific time points.

cAMP Treatment: Proteins and Transcripts Overlap
E N D
Presentation Transcript
Figure S3 A B 97 Proteins 220 Proteins 131 Transcripts 112 Transcripts 68 196 29 102 24 88 Figure S3. Venn diagrams illustrating the overlap between differentially expressed proteins and transcripts in response to cAMP treatment. The overlap of up-regulated proteins and transcripts is presented in panel A. The overlap of down-regulated proteins and transcripts in presented in panel B. Differentially expressed transcripts were obtained from the report of Oh et al.. Genes included in the analysis were restricted to those for which both protein and transcript quantification were available and for which the protein was differentially expressed at the 8, 12, or 18 hr time point.