Analog to Digital Conversion
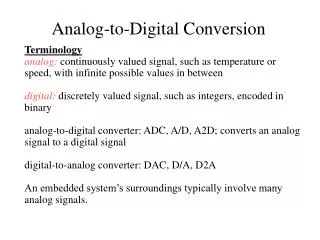
Analog to Digital Conversion. 12 bit vs 16 bit A/D Card. Input Volts = A/D 12 bit 2 12 = 4096 +10 Volts = 4095 0 Volts = 2048 − 10 Volts = 0. Input Volts = A/D 16 bit 2 16 = 65536 +10 Volts = 65536 0 Volts = 32768 − 10 Volts = 0.


Analog to Digital Conversion
E N D
Presentation Transcript
12 bit vs 16 bit A/D Card Input Volts = A/D 12 bit 212 = 4096 +10 Volts = 4095 0 Volts = 2048 −10 Volts = 0 Input Volts = A/D 16 bit 216 = 65536 +10 Volts = 65536 0 Volts = 32768 −10 Volts = 0 16 bit cards have much higher resolution.
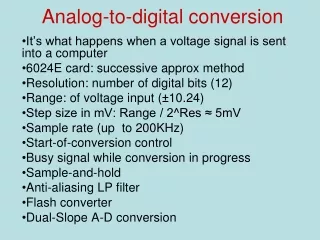
Nyquist Sampling Theorem • If you sample the signal to the left at too slow of a rate you will not know if the point off the curve is valid or noise. • According to the Nyquist Sampling Theorem you must sample at least twice as fast as the highest frequency of the signal.
Nyquist Theorem Applied to EMG Sampling • The middle graph shows that all of the EMG data are below 500 Hz, therefore you should sample EMG at 1000 Hz [twice the highest frequency in your signal].
Analog Signals • You can understand why CDs have such high fidelity if you understand the analog-to-digital conversion process better. • Let's say you have a sound wave, and you wish to sample it with an ADC. • Here is a typical wave (assume here that each tick on the horizontal axis represents one-thousandth of a second): • When you sample the wave with an analog-to-digital converter, you have control over two variables: • The sampling rate - Controls how many samples are taken per second • The sampling precision - Controls how many different gradations (quantization levels) are possible when taking the sample
Slow Sampling Rate • In the following figure, let's assume that the sampling rate is 1,000 per second and the precision is 10: • The green rectangles represent samples. • Every 1000th of a second, the ADC looks at the wave and picks the closest number between 0 and 9. • The number chosen is shown along the bottom of the figure. • These numbers are a digital representation of the original wave. • When the DAC recreates the wave from these numbers, you get the blue line shown in the following figure:
Higher Sampling Rates • You can see that the blue line lost quite a bit of the detail originally found in the red line, and that means the fidelity of the reproduced wave is not very good. • This is the sampling error. • You reduce sampling error by increasing both the sampling rate and the precision. In the following figure, both the rate and the precision have been improved by a factor of 2 (20 gradations at a rate of 2,000 samples/sec) • In the following figure, the rate and the precision have been doubled again (40 gradations at 4,000 samples/sec) • You can see that as the rate and precision increase, the fidelity (the similarity between the original wave and the DAC's output) improves. • In the case of CD sound, fidelity is an important goal, so the sampling rate is 44,100 samples per second and the number of gradations is 65,536. At this level, the output of the DAC so closely matches the original waveform that the sound is essentially "perfect" to most human ears.
National Instruments PCI-6224 [New Dell Computer] • 16 bit resolution • 32 single-ended inputs • Max Sampling rate of 250 K Samples/sec
National Instruments PCI-6251 [old Dell] • 16 bit resolution • 16 channels • 1.25 M Samples/s • 7 different voltage ranges • Voltage triggered sampling
National Instruments PCI-6229 • 16 bit resolution • 250 KHz samples/s • Input Range: ± 10 V ± 5 V ± 1 V ± 0.2 V
Keithley – Metrabyte 1802 HC • Key Features and Benefits: • Maximum sample rate of up to 333kS/s • 12-bit inputs: 64 single-ended or 32 differential • 4 digital inputs, 8 digital outputs • 2 analog outputs • High and low programmable gains • Extensive triggering options • DriverLINX™ and TestPoint™ software drivers • LabVIEW™ VIs • The KPCI-1802HC features low-gain inputs of 1, 2, 4, and 8. • These boards feature continuous, high-speed, gap-free data acquisition. Sample any single channel at any gain up to 333kS/s. Multiple channels can be sampled at aggregate rates of up to 312.5kS/s. • The KPCI-1801HC/1802HC boards feature flexible clocking, triggering, and gating modes and provide 4 data transition methods: Bus mastering, Interrupt mode, Target mode, and Programmable Burst mode.