Download
1 / 10
100 likes | 197 Vues
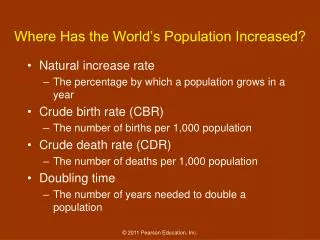
Where Has the World’s Population Increased?. Natural increase rate The percentage by which a population grows in a year Crude birth rate (CBR) The number of births per 1,000 population Crude death rate (CDR) The number of deaths per 1,000 population Doubling time

E N D
Where Has the World’s Population Increased? • Natural increase rate • The percentage by which a population grows in a year • Crude birth rate (CBR) • The number of births per 1,000 population • Crude death rate (CDR) • The number of deaths per 1,000 population • Doubling time • The number of years needed to double a population
World Population Growth Figure 2-8
Where Has the World’s Population Increased? • Fertility • Total fertility rate (TFR) • Mortality • Infant mortality rate (IMR) • Life expectancy
Figure 2-13 Figure 2-14 • Notice that places with high TFRs tend to have high IMRs and that places with low TFRs have low IMRs.
Why Is Population Increasing at Different Rates? • Demographic transition • Four stages • Stage 1: Low growth • Agricultural revolution • Stage 2: High growth • Industrial Revolution • Stage 3: Moderate growth • Stage 4: Low growth • Zero population growth (ZPG)
Demographic Transition Figure 2-15
Why Is Population Increasing at Different Rates? • Population pyramids • A bar graph showing a place’s age and sex composition • Shape of the pyramid is determined mainly by the CBR • Age distribution • Dependency ratio • Sex distribution • Sex ratio
Population Pyramids Figure 2-19
Why Is Population Increasing at Different Rates? • Countries are in different stages of the demographic transition • Three examples: • Cape Verde = High growth • Stage 2 since the 1950s • Chile = Moderate growth • Stage 3 since the 1960s • Denmark = Low growth • Stage 4 since the 1970s
Why Is Population Increasing at Different Rates? • Demographic transition & world population growth • Most countries = stage 2 or stage 3 of the Demographic Transition • Stages 2 and 3 are characterized by significant population growth • No country is in stage 1 of the demographic transition • It is easier to cause a drop in the CDR than in the CBR