Sector Capacity Prediction for Traffic Flow Management
280 likes | 460 Vues
Sector Capacity Prediction for Traffic Flow Management. Lixia Song April 13 th , 2010. En Route Congestion. Uncertain weather forecasts indicate current and future loss of airspace capacity…. Uncertain traffic forecasts provide airspace demand…. If demand exceeds capacity,

Sector Capacity Prediction for Traffic Flow Management
E N D
Presentation Transcript
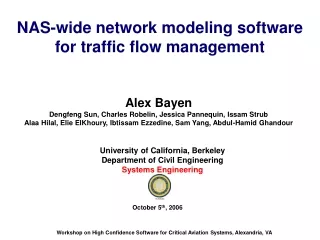
Sector Capacity Prediction for Traffic Flow Management Lixia Song April 13th, 2010
En Route Congestion Uncertain weather forecasts indicate current and future loss of airspace capacity… Uncertain traffic forecastsprovide airspace demand… If demand exceeds capacity, delays will occur and safety may be compromised. Role of TFM: Balance demand vs. capacity. Key function: Predicting capacity/congestion. Required: A good metric of capacity/congestion. Congestion Alerts Air traffic control sector
Increasing Complexity Sector Capacity What is Sector Capacity? Cited from EUROCONTROL Experimental Center Note No. 21/03 EDYCOLO Wednesday 4 July 2001 Workload Overload Threshold Aircraft Count (N)
A Good Sector Capacity Metric for En Route TFM Decision Support… • Better represents sector workload, and workload threshold, considering traffic complexity • Is intuitive and relevant to human decision-makers • Provides insight into congestion resolution options • Is predictable at useful look-ahead times (30 min – 2 hr) • Captures impact of convective weather
Aggregated factors (flow characteristics) for predicting sector capacity Traffic Flow Management Flow Structure to Represent Traffic Complexity for TFM Traffic Complexity Air Traffic Control • Aggregate flow variables are more easily predicted at TFM time frames than aircraft interaction variables • Flow structure is tightly related to controllers control strategy • Flow structure provides insight into congestion resolution options Controller Workload Detailed factors (traffic characteristics) for Dynamic Density
Predicted flow pattern The Flow Pattern Based Approach • Identify the primary set of traffic flow patterns for each sector • Assess the sector capacity for each pattern of the set • Predict the sector capacity through pattern recognition 18 20 22 Best Match
Case A Case B Case C 2 2 2 2 2 2 2 3 4 3 6 12 6 Under Severe Weather Impact
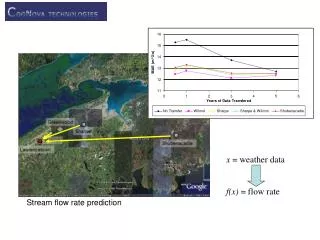
Under Weather Impact--- Available Sector Capacity Ratio LL’s CWAM1 model is usedto estimate the WAAF AvailableFlowCapacityRatio is determined by mincut theory (inspired by METRON) Traffic flow pattern is predicted with flows defined by sector transit triplets
The Effect of Convective Weather on Sector Capacity • Compared three sector weather impact indexes • 2-D weather coverage • 3-D WAAF coverage • Flow-based AvailableSectorCapacityRatio • Answer the following questions with statistical analysis of historical data • Which sector weather impact index has the strongest correlation with actual sector capacity • What’s the predictability of these sector weather impact indexes
Results from Initial Correlation Analysis • June and July 2007 traffic and weather data were collected • The 95th percentile of sector throughput is used as the estimated actual sector capacity • Initial analysis on 48 high sectors shows • Flow-based AvailableSectorCapacityRatio has the strongest linear correlation with sector capacity for sectors with dominant flows • The AvailableFlowCapacityRatioof the dominant flow has strong linear correlation with the flow and sector capacity • Probabilistic CWAM1 with right threshold is needed to calculate WAAF • Initial analysis on 43 low sectors shows • Both Deterministic and probabilistic CWAM1 do not work well for most of the low sectors
Linear Correlation between 95th Percentile of Sector Throughput and Sector Weather Impact Indexes
Linear Correlation between 95th Percentile of Flow Throughput and AvailableFlowCapacityRatio ZDC18 ZDC16-ZDC12-ZDC18 ZDC17 ZDC72-ZDC12-ZDC18 ZDC12 ZDC72 ZDC16-ZDC12-ZDC17 ZDC16
Correlation between 95th Percentile of Sector Throughput and AvailableFlowCapacityRatio
Initial Results of Predictability Analysis • Predictability of 2D weather coverage and 3D WAAF coverage are comparable • The predictability of available flow capacity ratio is relatively lower than the other two • 3D WAAF coverage and the reduced flow capacity ratio tend to be over-predicted • Both due to the over-prediction of CIWS echo top
Sensitivity to Weather Location 36-16-12 Omincut Cases with the prediction to be 0 but the actual to be 1
Future Research • Develop probabilistic model to capture weather prediction uncertainty, especially weather shape and location • Improve the flow-based model with more research on translating the flow blockage to sector capacity reduction • Consider the impact of weather on traffic complexity • Enhancing available flow capacity ratio calculation to more accurately estimate impact of transition flows • Flow capacity prediction and usage in both current and future operational environment • This analysis reveals the directional (flow) capacity usage in the current operational environment • NAS-Wide analysis is necessary
Questions for FCA Capacity • What is FCA capacity? • What is a good metric of FCA capacity? • How to predict the nominal FCA capacity? • How to reduce the FCA capacity under weather impact?
16-12-18 16-12-14 99-12-11 16-12-17 Sector Transit Triplets to Represent Flows 1/6/04 14Z ZDC12 Major Triplets (actual traffic) • Flows are the triplets that have at least two aircraft within the given time period.
Identify Primary Set of Traffic Flow Patterns with Self-Organizing Maps (SOMs) P P : Major Flow : Major Flow 3 3 • Unified distance matrix visualizes distances between neighboring traffic flow patterns, and helps to see the cluster structure of the traffic flow patterns • Each component plane shows the values of each feature in the patterns organized in U-Matrix Others Others P P : Major Flow : Major Flow 2 2 36 36 - - 16 16 - - 10 10 P P : Major Flow : Major Flow 1 1 36 36 - - 16 16 - - 12 12
Assessing Sector Capacity Through Observing System Performance
Weather Avoidance Altitude Field (WAAF) LL’s CWAM1