Download

1 / 9
90 likes | 228 Vues
GIS for Faster Analysis of Dam-Break Flows. Steve Pitman GIS in Water Resources – Fall 2003 Dr. David Maidment – UT Austin. The Problem:. A breached dam releases large volumes of water very rapidly Can’t predict dam-break floods using observations of natural floods

E N D
GIS for Faster Analysis of Dam-Break Flows Steve Pitman GIS in Water Resources – Fall 2003 Dr. David Maidment – UT Austin
The Problem: • A breached dam releases large volumes of water very rapidly • Can’t predict dam-break floods using observations of natural floods • Existing dam-break models • Complex, tricky and time consuming • Not conducive to rapid analysis
Approx. 77,000 total Consider a worst case scenario: On the Colorado River, Glen Canyon Dam and Hoover Dam, 370 miles apart, created Lake Powell and Lake Mead with combined storage equal to roughly four times the river’s annual flow. Dams in the U.S. USBR Photo What would this water do if rapidly released? Lake Powell USBR Photo
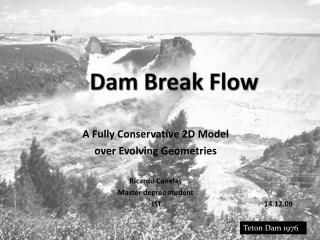
Teton Dam, Idaho – June 5, 1976 Teton Dam, Idaho – present day
GIS in Dam-Break Analysis Today • Pacific Disaster Center uses the M2M interface to translates FLDWAV output for display in ArcGIS • NWS developing FLDWAV-GIS link for displaying flood predictions • PBS&J (FEMA Contractor) has fielded a Watershed Analyst extension that automates pre- and post-processing of watershed modeling data
FLDWAV Input: Dam parameters Valley geometry Flood Routing Finite-difference solution of dynamic wave equations Output: Flow rates & depths at selected locations • Estimate breach characteristics • Geometry • Formation time Outflow Hydrograph Current Dam-Break Models • DWOPER & DAMBRK developed by National Weather Service (NWS) in 1970’s • NWS released FLDWAV in 1990’s • Combined DWOPER & DAMBRK • Added functionality
GIS Geospatial data Time Series data Geodatabase Adding Automation with GIS Interface Data Model Pre-Processing Post-Processing
Example USGS – The National Map
Resources • Applied Hydrology, Chow et al, McGraw Hill (1988) • U.S. Geological Survey websites • U.S. Bureau of Reclamation websites • National Inventory of Dams, U.S. Army Corps of Engineers • Arc Hydro, Maidment, ESRI Press (2002) • Source of photos