Download
1 / 48
500 likes | 656 Vues
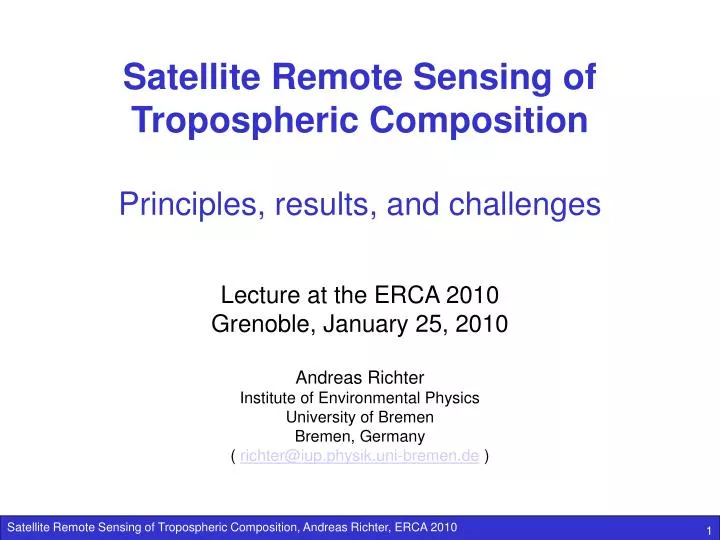
Satellite Remote Sensing of Tropospheric Composition Principles, results, and challenges Lecture at the ERCA 2010 Grenoble, January 25, 2010 Andreas Richter Institute of Environmental Physics University of Bremen Bremen, Germany ( richter@iup.physik.uni-bremen.de ). Overview.

E N D
Satellite Remote Sensing of Tropospheric Composition Principles, results, and challenges Lecture at the ERCA 2010 Grenoble, January 25, 2010 Andreas Richter Institute of Environmental Physics University of Bremen Bremen, Germany ( richter@iup.physik.uni-bremen.de )
Overview • What is Remote Sensing? • How can the troposphere be probed by remote sensing? • What is the sensitivity of remote sensing measurements? • A few examples for tropospheric satellite observations • What is the future of satellite remote sensing?
The Eye as a Remote Sensing Instrument • eye: remote sensing instrument in the visible wavelength region (350 - 750 nm) • signal processing in the eye and in the brain • colour (RGB) and relative intensity are used to identify surface types • large data base and neuronal network used to derive object properties
The Eye as a Remote Sensing Instrument • eyes are scanning the environment with up to 60 frames per second • 170° field of view, 30° focus
!!! The Eye as a Remote Sensing Instrument • stereographic view, image processing, and a large data base enables detection of size, distance, and movement
The Eye as a Remote Sensing Instrument • the human eye is a passive remote sensing instrument, relying on (sun) light scattered from the object • no sensitivity to thermal emission of objects unlike in some other animals ? 8-14 microns image of a cat
!!! The Eye as a Remote Sensing Instrument • We can also apply active remote sensing by using artificial light sources
Validation Changed Radiation Radiation Sensor Object Measurement A priori information Data Analysis Final Result Forward Model Schematic of Remote Sensing Observation
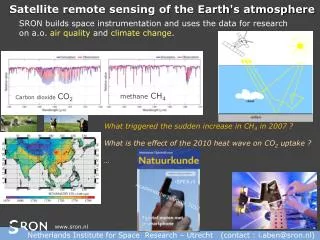
The Electromagnetic Spectrum • nearly all energy on Earth is supplied by the sun through radiation • wavelengths from many meters (radio waves) to nm (X-ray) • small wavelength = high energy • radiation interacts with atmosphere and surface • absorption (heating, shielding) • excitation (energy input, chemical reactions) re-emission (energy balance)
Wavelength Ranges in Remote Sensing UV: some absorptions + profile information aerosols vis: surface information (vegetation) some absorptions aerosol information IR: temperature information cloud information water / ice distinction many absorptions / emissions + profile information MW: no problems with clouds ice / water contrast surfaces some emissions + profile information
Scattering from a cloud Emission from a cloud Transmission through a cloud Cloud Scattering within a cloud Scattering / reflection on a cloud Transmission through a cloud Emission from the ground Scattering / Reflection on the ground Absorption on the ground Radiative Transfer in the Atmosphere Atmosphere Absorption Scattering Emission Aerosol / Molecules
Typical light paths: UV altitude sensitivity • Dark surface • Strong Rayleigh scattering • Most photons are scattered above absorption layer => Low sensitivity to BL signals!
Typical light paths: visible altitude sensitivity • Brighter surface • Significant Rayleigh Scattering • Many photons are scattered above absorption layer => Reduced sensitivity to BL signals!
Bright surface (snow, ice): UV and visible altitude sensitivity • Surface reflection dominates • Multiple scattering in surface layer => Enhanced sensitivity to BL signals!
Typical light paths: NIR altitude sensitivity • Bright surface (except for oceans) • Negligible Scattering => Very good sensitivity to BL signals!
Typical light paths: thermal IR altitude sensitivity • Radiation is emitted from different altitudes • Sensitivity to surface layer depends on thermal contrast => Usually low sensitivity to BL signals!
Thermal IR with high thermal contrast (deserts) altitude sensitivity Radiation is emitted from different altitudes and from the surface If surface is hotter than lower atmospheric layer, good sensitivity to BL signals!
Example: Thermal Contrast IASI Day Night Clerbaux, C., et al., Atmos. Chem. Phys., 9, 6041–6054, 2009 Thermal contrast (temperature difference between surface and first atmospheric layer) is highest in the morning over barren land Vertical sensitivity varies in space and time
Vertical sensitivity of satellite measurements The sensitivity of the satellite measurements depend on the altitude of the absorbing layer This is often expressed in the form of weighting functionswhich give the sensitivity of the signal as function of altitude As the vertical distribution can usually not be (completely) determined from the measurements, a priori information is needed in the retrieval The dependence of the retrieved quantity on the real atmospheric profile depends on both, the sensitivity of the measurements and the assumptions made in the a priori This is often expressed as averaging kernels which describe the dependence of the retrieved quantity on the amounts of trace gas in the different altitudes in the atmosphere Comparison of satellite retrievals with other measurements are only meaningful if the averaging kernels are accounted for
Vertical sensitivity of satellite measurements altitude altitude sensitivity concentration Estimated sensitivity A priori In the retrieval process, the vertical sensitivity is accounted for For IR measurements, it can be well estimated from the temperature measurements For UV/vis measurements, aerosols and surface reflectance are often a problem Where there is no sensitivity, the a priori will be retrieved
Example: Averaging Kernels for CO George et al., Atmos. Chem. Phys., 9, 8317–8330, 2009 Depending on spectral resolution and wavelength, the number of degrees of freedom (DOFS) varies, as well as the shape of the averaging kernels
How do we get vertical resolution in nadir IR observations? Low p High p intensity wavenumber Thermal infrared measurements have intrinsic altitude information from • Pressure broadening • Temperature dependence of line strengths • Pressure shift The amount of vertical information depends on • Spectral resolution of the measurement • Signal to noise ratio • The molecule • Thermal contrast
Assimilated Stratosphere How do we get vertical resolution in nadir UV/vis observations? Basic problem: Nadir measurements contain stratospheric and tropospheric absorptions and in many cases no intrinsic vertical information
Clouds: Shielding Effect • the part of an absorber profile situated below a cloud is basically “hidden” from view for the satellite • only through thin clouds over reflecting surfaces, sensitivity towards the lower part of the profile is still relevant • the shielding effect is larger than expected from the geometrical size of the cloud because of its brightness 50% cloud cover but only 25% surface contribution! Rayleigh scattering albedo = 0.75 albedo = 0.25
Clouds: Albedo Effect some photons are scattered before reaching the absorber • the part of an absorber above a cloud is better visible from space as the ratio of photons that go through it increases through the albedo effect • the lower the cloud, the larger the effect • in the UV this is more important than in the visible as Rayleigh scattering is proportional to -4 Rayleigh scattering most photons are absorbed on the ground albedo = 0.25
Clouds: Albedo Effect many photons are scattered below the absorber • the part of an absorber above a cloud is better visible from space as the ratio of photons that go though it increases through the albedo effect • the lower the cloud, the larger the effect • in the UV this is more important than in the visible as Rayleigh scattering is proportional to -4 Rayleigh scattering albedo = 0.75 albedo = 0.25
Effect of Spatial Resolution: Example NO2 OMI: 13:30 LT • For species with short atmospheric life time, horizontal variability is large • Spatial resolution of sensor is relevant for interpretation • Spatial resolution also influences cloud fraction • Time of overpass may also play a role!
Satellite Orbits (Near) Polar Orbit: • orbits cross close to the pole • global measurements are possible • low earth orbit LEO (several 100 km) • ascending and descending branch • special case: sun-synchronous orbit: • overpass over given latitude always at the same local time, providing similar illumination • for sun-synchronous orbits: day and night branches Geostationary Orbit: • satellite has fixed position relative to the Earth • parallel measurements in a limited area from low to middle latitudes • 36 000 km flight altitude, equatorial orbit http://www2.jpl.nasa.gov/basics/bsf5-1.htm http://www.ccrs.nrcan.gc.ca/ccrs/learn/tutorials/fundam/chapter2/chapter2_2_e.html
Why do we need satellite measurements? • not all measurement locations are accessible (atmosphere, ice, ocean) • remote sensing facilitates analysis of long time series and extended measurement areas • for many phenomena, global measurements are needed • remote sensing measurements usually can be automated • often, several parameters can be measured at the same time • on a per measurement basis, remote sensing measurements usually are less expensive than in-situ measurements
What is problematic about satellite measurements? • remote sensing measurements are always indirect measurements • the electromagnetic signal is often affected by more things than just the quantity to be measured • usually, additional assumptions and models are needed for the interpretation of the measurements • usually, the measurement area / volume is relatively large • validation of remote sensing measurements is a major task and often not possible in a strict sense • estimation of the errors of a remote sensing measurement often is difficult
Comparison of different observation options • Nadir: • view to the surface • good spatial resolution • little vertical resolution • Limb: • good vertical resolution, • but only in the UT/LS region • large cloud probability • UV/vis/NIR: • sensitivity down to surface • relevant species observable • limited number of species • daytime only • no intrinsic vertical resolution in nadir • aerosols introduce uncertainties in light path • IR: • large number of potential species • day and night measurements • some vertical resolution in nadir • weighted towards middle troposphere • problems with strong absorbers • problems with dark (solar IR) orcold (thermal IR) surfaces
MOPITT Instrument: IR gas correlation spectrometer with pressure modulation Operational since March 2000 Spatial resolution: 22 x 22 km2 Day + night measurements Global coverage: 3.5 days Species: CO (1 – 2 DOFS)
MOPITT: CO column MOPITT CO column January 2009 CO total column [1018 moelc cm-2 http://www.acd.ucar.edu/mopitt/ Hemispheric gradient Topography Pollution in Asia Biomass burning in Africa
TOMS Instrument: UV discrete (6) wavelengths grating spectrometer Operational: October 1978 - 2004 Spatial resolution: 50 x 50 km2 Global coverage: 1.5 days Species: O3, SO2
TOMS: Ozone columns Ziemke, J. R et al., (2001), “Cloud slicing”: A new technique to derive upper tropospheric ozone from satellite measurements, J. Geophys. Res., 106(D9), 9853–9867 Large scale tropospheric ozone patterns retrieved using the cloud slicing method During El Nino year, clear ozone maximum over Indonesia Origins: photochemical smog from biomass burning and change in circulation pattern
GOME / GOME-2 GOME-2 on MetOp since 1.2007 80 x 40 km2 1.5 days Instrument: 4 channelUV/vis grating spectrometer Operational on ERS-2 7.1995 – 6.2003 ... Spatial resolution 320 x 40 km2 Global coverage: 3 days Species: O3, NO2, HCHO, CHOCHO, BrO, IO, SO2, H2O
GOME: Polar springtime BrO Richter, A. et al., GOME observations of tropospheric BrO in Northern Hemispheric spring and summer 1997, Geophys. Res. Lett., No. 25, pp. 2683-2686, 1998. Large regions of enhanced boundary layer BrO in polar spring Autocatalytic release of Br from sea salt from aerosols / frost flowers / ice surfaces Rapid ozone destruction and link to Hg chemistry
SCIAMACHY • Vis channels 3-4 • NIR channels 5-6 • SWIR channels 7-8 • scanner modules • telescope • pre-disperser • UV channels 1-2 www.sciamachy.de Instrument: 8 channel UV/vis/NIR grating spectrometernadir, limb + occultation measurements Operational on ENVISAT since 8.2003 Spatial resolution (30) 60 x 30 km2 Global coverage: 6 days Species: O3, NO2, HCHO, CHOCHO, BrO, IO, SO2, H2O, CH4, CO2, CO
SCIAMACHY: Methane: The missing tropical source • SCIAMACHY measurements and atmospheric models agree well over most of the globe • In the tropics, the model underestimates SCIAMACHY measurements • This indicates a tropical CH4 source missing in current models • Important to assess impact of anthropogenic activities • Effect is smaller using current satellite data version but still there SCIAMACHY SCIAMACHY – TM3 TM3 (model) Frankenberg et al., science, 308. no. 5724, pp. 1010 - 1014DOI: 10.1126/science.1106644, 2005
SCIAMACHY: CO2 in the Northern Hemisphere Buchwitz et al., ACP, 2007; Schneising et al., ACP, 2008 • Detection of annual cycle • Detection of year-to-year increase • Detection of spatial variability • Not yet accurate enough for Kyoto monitoring on country level
OMI www.knmi.nl/omi/ Instrument: UV/vis imaging grating spectrometer (push-broom) Operational on Aura since October 2004 Spatial resolution: up to 13 x 24 km2 Global coverage: 1 day Species: O3, NO2, HCHO, CHOCHO, BrO, SO2
OMI: SO2 columns 9.2004 – 6.2005 Carn, S. A., et al., t (2007), Sulfur dioxide emissions from Peruvian copper smelters detected by the Ozone Monitoring Instrument, Geophys. Res. Lett., 34, L09801, doi:10.1029/2006GL029020. SO2 signals from volcanoes in Ecuador and Columbia Clear signature of Peruvian copper smelters Very large sources of local pollution Effect of (temporary) shut down and (permanent) implementation of emission reductions (H2SO4 production) can be monitored
IASI Clerbaux, C., et al., Atmos. Chem. Phys., 9, 6041–6054, 2009 Instrument: IR Fourier Transform Spectrometer, 0.5 cm-1 Operational on MetOp since January 2007 Spatial resolution: circular, 12 km diameter Global coverage 2x per day (day and night) Species: H2O, HDO, CH4, O3, CO, HNO3, NH3, CH3OH, HCOOH, C2H4, SO2, CO2, N2O, CFC-11, CFC-12, HCF-22, OCS, ...
IASI: NH3 Clarisse et al., nature geoscience, doi:10.1038/ngeo551, 2009 First global measurement of Ammonia Ammonia hot-spots where intense agriculture / livestock leads to high emissions Relevant for particulate formation and acidification / eutrophication
Summary and Conclusions Satellite observations of tropospheric composition in the UV/vis, NIR and thermal IR provide consistent global datasets for many species including major air pollutants such as O3, CO, NO2, and HCHO The measurements are averaged horizontally and vertically which makes them difficult to compare to point measurements Remote sensing in an indirect method that necessitates use of a priori information in the data retrieval which has an impact on the results Visible and NIR measurements provide good sensitivity to the boundary layer, the thermal IR has intrinsic vertical information In spite of the relative large uncertainties involved in satellite remote sensing , they provide a unique source of information on the composition of the troposphere
What is the future of satellite measurements of tropospheric trace gases? • Satellite measurements will be improved by • Better spatial resolution • Better temporal resolution (geostationary observations) • Better coverage of species and vertical resolution (extension of the wavelengths covered (from UV to IR) • Better precision (higher spectral resolution in the IR) • High vertical resolution (active systems) • The usefulness of satellite data will be improved by better integration with other measurements • Satellite data will be strongly integrated in atmospheric models
Active measurements: CALIOP aerosol http://www-calipso.larc.nasa.gov/
Thank you for your attention and questions please! http://www.animationlibrary.com/animation/25494/Alarm_jumps/