Understanding Economic Concepts and Perspectives in Synthesis Economics
This document outlines the major themes, economic concepts, and different perspectives covered in the Fall 2002 Economics course. The material covers crucial topics such as the role of surplus in financing military power and the arts, the impacts of globalization and trade, the discussion on capitalism as an economic system, and more. It delves into economic paradigms, tools applications, demand and supply dynamics, and the application of various economic principles in everyday life decisions. The text provides a comprehensive overview of the course content and its relevance in understanding economic systems and decision-making processes.


Understanding Economic Concepts and Perspectives in Synthesis Economics
E N D
Presentation Transcript
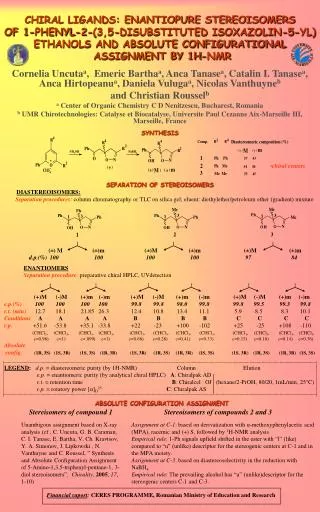
Synthesis Econ 109 Fall 2002 Looking Back
Outline • Themes: The Big Issues • Economic Concepts • Perspectives By Course Section • What We Learned • Why We Learned It • How We Can Use It
The Big Issues • Looking Out for # 1 • answer: save and invest (Course: Part I) • Can a country (or civilization) generate a surplus to finance military power and/or the arts and sciences? • Answer: Malthus- landowners squeeze the peasants • Answer: Marx- capitalists squeeze the workers, (Course: Part III) • Answer: Adam Smith- markets lead to efficiency and general welfare
The Big Issues (cont.) • Answer: Modern economists- population growth increases the labor force; saving and investing increases capital; capital deepening increases worker productivity; research and development promotes technologival change (Course: Parts II and III) • Answer: Monopoly power squeezes consumers (Course: Part III)
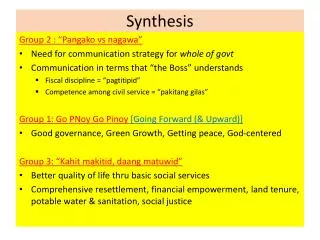
Good trade permits decoupling of production and consumption, i.e. promotes specialization growth in GDP per capita leads to more equity trade promotes competition and curbs monopoly power Bad growth uses up world resources global warming loss of forests loss of clean oceans and rivers (Course: Part IV) Is Globalization & Trade Good or Bad?
Good if markets are competitive, then economy is efficient Bad instability, subject to fear, decreases in consumption and investment, capital flight monopoly power exploits consumers, wastes resources, and corrupts democracy Is Capitalism a Good Economic System or Not? (Course: Parts II, III, IV)
Economic Concepts • Economic Paradigm: A Way of Thinking • #1 set out your options for choice • #2 value these options ( using market prices or personal values or social values) • #3 optimize, i.e. pick the best choice • Marginal Principle • set marginal benefit(revenue) equal to marginal cost (if marginal revenue is constant then marginal revenue=average revenue=price) • Reality Principle • Scarcity and Opportunity Cost • Diminishing Returns
Concept Applications • Economic Paradigm • buying a car; Lecture 2 • supplying your time to the labor market: L.4 • choosing the investments with the average rate of return-risk tradeoff that is best for you: L5 • crime (pollution)-consumption possibility frontier, community choice of optimal crim (pollution) levels L.17
Tools Applications • Keynesian Cross: L. 6, L. 7 & L. 10 • Production Possibility Frontier • Guns or Butter L. 8, L. 10 • Agricultural goods or manufacturing goods L. 12 • Ag. Or mfg. Goods: a closed economy vs. trade andan open economy • Demand and Supply • demand for mortgage credit: L. 3 • demand & supply of funds in the bond market: L. 4 • demand & supply of banking reserves: L. 9 & L. 10
Tools Applications • Demand and Supply • demand and supply of world copper L.14 • demand and supply of pesos: capital flight from peso L. 15 • demand & supply of $, capital flight from the baht L. 16 • demand and supply of bahts, capital flight from the baht L. 16 • demand & supply of low-skilled labor contrasted to demand & supply of high-skilled labor, the wage differential for skill L 16
Tools Applications • Production Function, wage bill, surplus L. 11 • Marginal product of labor (demand), supply of labor, surplus L. 12 • demand & supply of labor: minimum wage L. 12 • demand & supply of labor: capital deepening L.13 • demand & supply of labor: technological change L. 13 • Consumer Surplus & Competitive Markets L. 13 • consumer surplus, monopoly profit, and dead-weight loss L.14
Tools Applications • Lorenz Curve and Gini Coefficient: L.16
Perspective • What we learned • Why we learned it • How we can use it
Purchasing the Big Ticket Items: Cars and Homes • Why: Need to be well informed about the important decisions in our lives • What: cars and houses last a while, and a $ this year is equivalent to a $ next year times one plus the interest rate $(t) = $(t+1)(1 + r) • What: cars depreciate physically and most cars depreciate economically • What: houses depreciate physically and will likely appreciate in value in CA
Cont. • What: mortgage payments on loans are front loaded with interest, so equity will build slowly • What: Need to save for the down payments, so we need to budget our expenditures • How to use this info: when the time comes, tools are available for free on the internet or at low cost in common software packages
Tool: Income-Expense Statement Savings Equals Income Minus Expenditure
Economic Principles • A dollar today is not the same as a dollar tomorrow! • $10 today @ 6.9% = $10 * 1.069 next year • The “opportunity cost” of spending your money is the foregone interest. • The cost of buying the services of the car, neglecting operating costs: • depreciation: owning a new car • foregone interest
Increasing the Length of the LoanTradeoffs • monthly payment amount decreases • amount of total payments increases • amount of total interest payments increases • total interest as % of total payments increases
Thinking About Problems:The Economic Paradigm • describing the alternatives to choose among • pricing the alternatives • choosing the best alternative
The Economic Paradigmexample: buying a car • describing the alternatives to choose among • cash: the opportunity cost of losing interest • lease: depreciation included in payments • loan: sell the car to account for depreciation • pricing the alternatives: valuation • Oscar Wilde- economists know the price of everything and the value of nothing • choosing the best alternative • best: lowest cost • possibly subject to a constraint: having the $
What to Do with Those Savings • Why: investments that earn more will let you buy your cars and house sooner • What: investments have two attributes, average rate of return(the reward), a good, and variability in the rate of return(the risk), a bad • What: You want the investment with the highest average rate of return for a given level of risk • What: returns are equal to capital gains (losses) plus dividends
Tool: Efficient Portfolio- Most Return for Given Risk Economic paradigm step1
Economic Paradigm step 2: Valuation of Mean Return and Risk Assumption: Mean Return is Good, Risk is Bad: U =U(M,R) better Mean Return, M worse B C Iso - Preference Curves A Risk, R Prefer B to A; Prefer B to C
Economic Paradigm step 3: Choosing the Best Investment for You Optimum for B Investor B: not very risk averse
Personal Earnings and Human Capital • Why: Your major source of $ is likely to be income • What: Your Earnings will depend upon • your ability • your knowledge • your work experience • How: Hang in until you get your college degree
Families: Average Income and Average Net Worth, 1995 Even with wealth of $100, 000, at 5%, you earn only $ 5, 000 of income so you will need to work Source: Consumer Federation of America
Tool: Earnings Opportunities: Trading Time for Money Opportunities for trading leisure for earnings (income) at a rate, $20 per hour, the market wage, determined by your stock of human capital(step one of the paradigm: describing the alternatives for choice) Earnings $480 Economic Paradigm step 1 $ 0 Leisure (learning) 0 hours 24 hours
Tool: Your preferences (tastes) for 2 goods, income & leisure Depicting your tastes graphically Earnings low value Iso-Preference Curves: You value all points on a curve equally high $480 Economic paradigm step 2 high value $ 0 Leisure (learning) 0 hours 24 hours
Putting the 2 tools together: explaining your supply of labor Earnings low value Individual’s Supply of Labor high $480 Economic paradigm step 3 $180 for 9 hrs of work Optimum high value Leisure (learning) $ 0 15 hours of leisure 0 hours 24 hours
Part Five: Economic Welfare and Public Policy • Why: we need to consider the welfare of fellow citizens, not just me-me-me • What: most folks that are poor are poor because they do not work • What: most folks that do not work have a low level of human capital, i. e. the labor market places a low value on their time • What: persistent pockets of poverty among female heads of households and their kids
Cont. • In the US, the rich are getting richer and the poor are getting poorer • In the US economy, there is a growing earnings premium on ability, on education, and on experience, i.e. on human capital • In the US, we can’t seem to get the poverty rate below 10% • How to use this info: on public policy issues when you vote
Life does not offer very good options for the uneducated low value Earnings slope of the iso-preference curve through the 24 hour endowment is the lowest wage at which you are willing to work high $480 $96 $ 0 Leisure (learning) 0 hours 24 hours dropout is unwilling to work for $4/hr
Poverty and Female Heads of Households Lab10: Children, Poverty, and Politics: US Census Bureau: Poverty in the United States: 2000
Poverty and Youth Lab 10: Children, Poverty, and Politics
Ratio of Median Earnings, Males: College Grad to High School Grad Source: Economic Report of the President, 1997
Growing Wage Differentials Between the Less Skilled and More Skilled: Less Demand for Less Skilled and More Demand for the More Skilled Source: Economic Report of the President, 1997
Cont. • What: In the world, developed countries have a more equitable distribution of income than undeveloped countries, one of the positive consequences of growth • What: In the world, political systems and history also count. Socialist countries and countries with mixed economies tend to be more equitable. However, their tax burden is also greater
Income Inequality Across the World Lab 7, Ch. 23, Internet Exercises, World Bank Links http://www.worldbank.org/depweb/
Higher Tax Burden in France than in the US Lab 7, Ch. 23, Internet Exercises, “Taking a Look at the Level of Economic Development and Well-Being in Countries Around the World” Link to Handbook of International Economic Statistics
Part Two: Macroeconomics and the US Economy • Why: because the economy affects your prospects for finding and keeping a job, the interest rate you pay on loans, and the return you get on your investments • What: There are two ways to measure the size of an economy, National Income and National Expenditure or GDP (circular flow). They have to be the same, i.e. in equilibrium
Cont. • What: GDP is equal to consumption by consumers plus investment by firms, plus spending by government plus net exports ( exports minus imports) • GDP = C + I + G + X - M
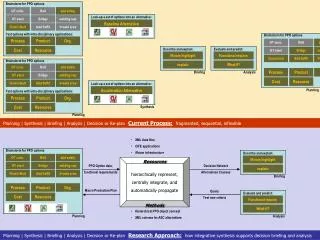
: Chapter Twenty Firms Firms • Conceptual Framework: Circular Flow Supply Goods Demand Goods Income Labor Households Households Income Perspective Expenditure Perspective Y = GDP
Expenditure Perspective: Open Firms Imports (puchases) Supply Goods Demand Goods Exports (Sales) Households Government Households: Consumption of Goods and Services Firms: Investment in Plant and Equipment Government: Purchase of Goods and Services All Three: Exports - Imports = Net Exports
Bust Income = expenditure I.e. Y = GDP Consumption, C Investment, I GDP GDP = C + I +G Total Expenditure GDP Line Aggregate Expenditure Unemployment Rate Oct. 2000 = 3.9% 450 GDP = Y National Income, Y Unemployment Rate Sept 2001 = 4.9 % Graphical Tool: The Keynesian Cross