Create Your Own Contour Island: Topographic Mapping Activity
In this engaging activity, you will develop a unique 'island' by graphing contour lines that represent elevations. Contour intervals should be set at 100 meters, and your island must feature three high points, including one that stands out as the highest. You'll also need to illustrate a steep side to add complexity to your design. This project will help you understand topographic mapping, the significance of elevation changes, and how contour lines effectively represent land structures. Let your creativity soar as you graph your island!

Create Your Own Contour Island: Topographic Mapping Activity
E N D
Presentation Transcript
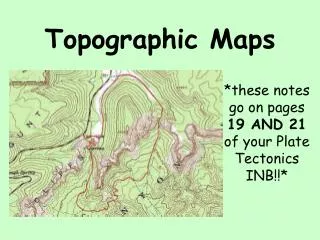
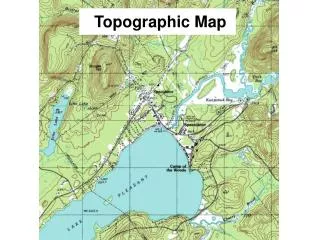
TOPOGRAPHIC MAPPING GRAPHING COUNTOUR LINES
GRAPHING COUNTOUR LINE • CONTOUR INTERVALS – the distance (m,ft) between contour lines. • Graphing contour lines shows you the elevation of a particular land structure. • As the dots on the graph go up – the elevation of the land mass goes up. • As the dots on the graph go down – the elevation of the land mass goes down.
ACTIVITY • You are required to develop your own ‘island’ with contour lines and graph the ‘island’. • You must have 3 high points • 1 point must be higher than the others • Your contour intervals must bee 100m • There must be a ‘steep’ side.