
Approaches to Mathematics: Graphs and Models
E N D
Presentation Transcript
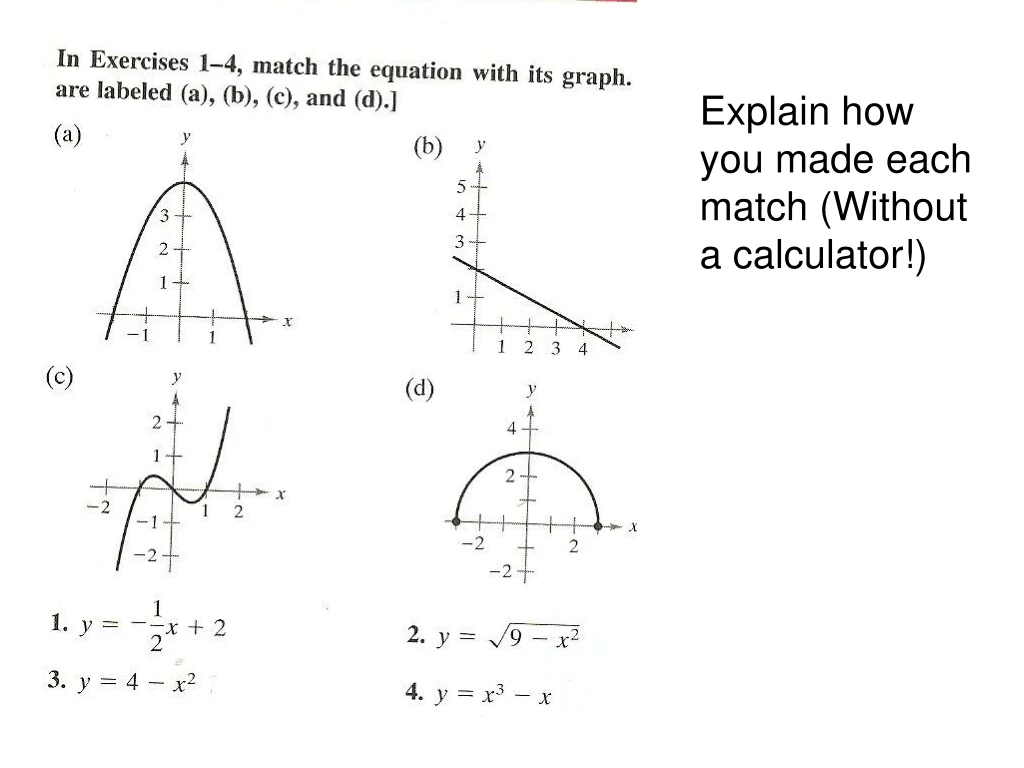
Warm-Up Explain how you made each match (Without a calculator!)
Section P.1: Graphs and Models p.3 - 10
4 Approaches to Mathematics: • Verbal – Explain in words • Numerical – Table of values • Graphical – Using graphs • Analytical – Manipulating symbols and equations
Sketch a graph of f(x) = 1 – x2 Method 1: Make a table and plot points.
Sketch a graph of f(x) = 1 – x2 Method 2: Using a graphing calculator.
Why not just always use a graphing calculator? • Give the number of zeros of f(x) = sin(ln x)
Why not always just use a graphing calculator? • Graph y =
Finding x and y-intercepts: x2y – x2 + 4y = 0
Symmetry: • X-axis: • Y-axis: • Origin:
Check for symmetry: y = (x + 2)2
Why does symmetry help? x – y2 = 2
Find Points of Intersection and check: • x2 + y = 5 x – y = 1


