POPULATION FORECASTING - Logistic CURVE METHOD
POPULATION FORECASTING - Logistic CURVE METHOD. GROUP MEMBERS. Kush Poorunsing Aman Sahadeo Arshaad Jeedaran Nevin Sunassee Pamben Moonsamy Kishan Joorawon. Population Forecasting. Important process in the design of waste water treatment plants


POPULATION FORECASTING - Logistic CURVE METHOD
E N D
Presentation Transcript
POPULATION FORECASTING - Logistic CURVE METHOD
GROUP MEMBERS Kush Poorunsing AmanSahadeo ArshaadJeedaran NevinSunassee PambenMoonsamy KishanJoorawon
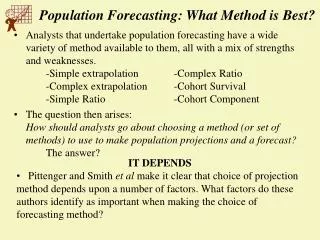
Population Forecasting • Important process in the design of waste water treatment plants • Factors affecting change in population: • Fertility/ Birth rate • Death rate • Migration
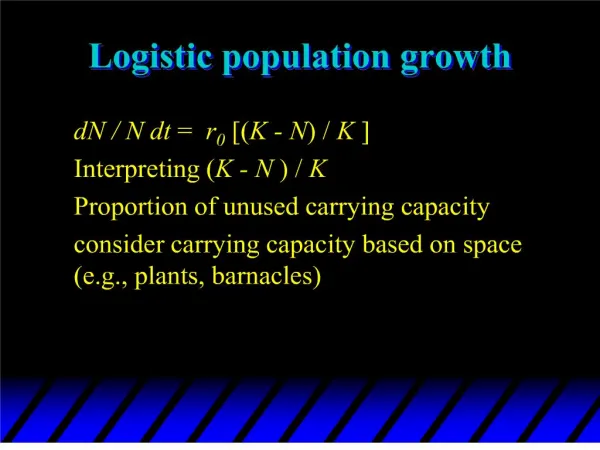
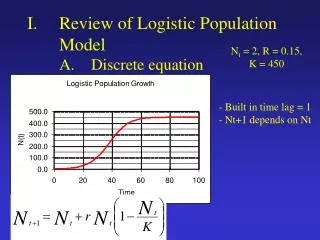
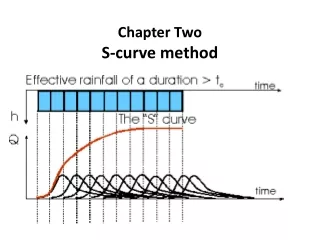
Logistic Method Saturation population • Follows some logical mathematical relationship. • has an S-shape combining a geometric rate of growth at low population with a declining growth rate as the population approaches some limiting value.
Equation - 1 • ………………. (1) • Where Pt: population at some time in the future Psat: population at saturation level t: number of years after base year a, b: data constants
Equation - 2 • ……………….. (2) • Where Psat: population at saturation level Po: base population P1, P2: population at time periods
Equation - 3 • …………………. (3) • ………………(4) • Where n: time interval between successive censuses
Example • The data for population censuses from 1851 to 2000 for Island of Rodrigues is given below. Estimate the expected population in 2011.
STEP 1 • Three successive years, represented by to, t1, and t2are chosen such that they are equidistant from each other. t0 t1 t2
STEP 2 • The number of years from toto t1and t1 to t2 is denoted by n. t0 n=28 t1 n=28 t2
STEP 3 • The population figures corresponding to to, t1, and t2are Po, P1and P2respectivelythrough which the logistic curve is to pass. t0 P0 n=28 t1 P1 n=28 P2 t2
CALCULATIONS - 1 • n=28 • P0= 11885, P1= 24769 and P2= 35779 • From equation 2, • ∴
CALCULATIONS - 2 • From equation 3, • ∴ • From equation 4, • ∴
CALCULATIONS - 3 • Replacing the values obtained in equation 1, the expected population for 2011 is: • = 2011-1944 = 67 years
CONCLUSION • Based on census reports, the population of Rodrigues in 2011 was 37,922 (Wikipedia) • Estimated population with logistic method is 38420.8 • 1.31% deviation from actual value
Advantages and Disadvantages • Advantages • Longer projection period compared to simple geometric procedures • Gives a better approximation than other methods. • Disadvantages • Mechanical process • Cannot predict decreasing population • Demographic and socioeconomic changes not considered • Requires a large number of observations covering a long period
References • Punmia, B.C, Arun, K.J., 2005. Water Supply Engineering. 2nd ed. New Delhi: Laxmi Publications • Annual Digest of Statistics 2011 [Online]. Available from: http://www.gov.mu/portal/goc/cso/file/AnnualDigestofStatistics2011.pdf • Rodrigues [Online]. Available from: http://en.wikipedia.org/wiki/Rodrigues