Download
1 / 48
480 likes | 583 Vues
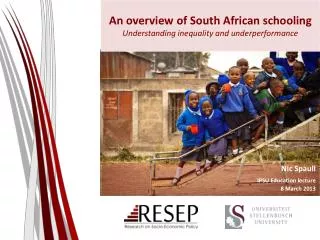
An overview of South Africa's schooling system challenges revealed through poor educational performance on assessments, lack of learning in the system, and the presence of two public schooling systems.

E N D
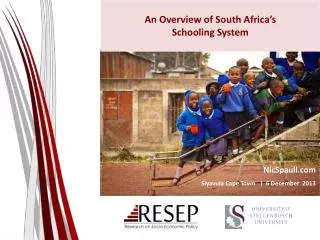
An Overview of South Africa’s Schooling System NicSpaull.com Carnegie 3 Church Consultative Workshop | UCT | 27 November 2013
Outline • SA performs extremely poorly on local and international assessments of educational achievement • In large parts of the schooling system there is little learning taking place • In SA we have TWO public schooling systems, not one. • Accountability & Capacity
1) South Africa performs extremely poorly on local and international assessments of educational achievement
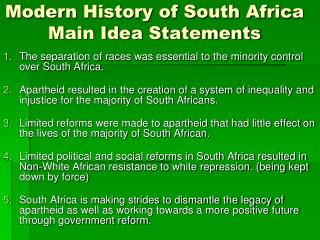
State of SA education since transition • “Although 99.7% of South African children are in school…the outcomes in education are abysmal” (Manuel, 2011) • “Without ambiguity or the possibility of misinterpretation, the pieces together reveal the predicament of South African primary education” (Fleisch, 2008: 2) • “Our researchers found that what students know and can do is dismal” (Taylor & Vinjevold, 1999) • “It is not an overstatement to say that South African education is in crisis.” (Van der Berg & Spaull, 2011)
Student performance 2003-2011 prePIRLS(2011) TIMSS (2011) ANA (2011) TIMSS (2003) PIRLS (2006) SACMEQ (2007) TIMSS 2003 (Gr8 Maths & Science) • Out of 50 participating countries (including 6 African countries) SA came last • Only 10% reached low international benchmark • No improvement from TIMSS 1999-TIMSS 2003 PIRLS 2006(Gr 4/5 – Reading) • Out of 45 participating countries SA came last • 87% of gr4 and 78% of Gr 5 learners deemed to be “at serious risk of not learning to read” SACMEQ III 2007(Gr6 – Reading & Maths) • SA came 10/15 for reading and 8/15 for maths behind countries such as Swaziland, Kenya and Tanzania ANA 2011 (Gr 1-6 Reading & Maths) • Mean literacy score gr3: 35% • Mean numeracy score gr3: 28% • Mean literacy score gr6: 28% • Mean numeracy score gr6: 30% TIMSS 2011(Gr9 – Maths & Science) • SA has joint lowest performance of 42 countries • Improvement by 1.5 grade levels (2003-2011) • 76% of grade nine students in 2011 still had not acquired a basic understanding about whole numbers, decimals, operations or basic graphs, and this is at the improved level of performance prePIRLS2011 (Gr 4 Reading) • 29% of SA Gr4 learners completely illiterate (cannot decode text in any langauge) • NSES 2007/8/9 • Systemic Evaluations 2007 • Matric exams
2) In large parts of the schooling system there is little learning taking place
Quantifying learning deficits in Gr3 Figure 1: Kernel density of mean Grade 3 performance on Grade 3 level items by quintiles of student socioeconomic status (Systemic Evaluation 2007) • Following Muralidharan & Zieleniak (2013) we classify students as performing at the grade-appropriate level if they obtain a mean score of 50% or higher on the full set of Grade 3 level questions. (Grade-3-appropriate level) 16% Only the top 16%of grade 3 students are performing at a Grade 3 level 51% 11%
NSES question 42NSESfollowed about 15000 students (266 schools) and tested them in Grade 3 (2007), Grade 4 (2008) and Grade 5 (2009). Grade 3 maths curriculum: “Can perform calculations using appropriate symbols to solve problems involving: division of at least 2-digit by 1-digit numbers” Even at the end of Grade 5 most (55%+) quintile 1-4 students cannot answer this simple Grade-3-level problem. “The powerful notions of ratio, rate and proportion are built upon the simpler concepts of whole number, multiplication and division, fraction and rational number, and are themselves the precursors to the development of yet more complex concepts such as triangle similarity, trigonometry, gradient and calculus” (Taylor & Reddi, 2013: 194) (Spaull & Viljoen, forthcoming)
By Gr 3 all children should be able to read, Gr 4 children should be transitioning from “learning to read” to “reading to learn” Red sections here show the proportion of children that are completely illiterate in Grade 4 , i.e. they cannot read in any language
SACMEQ 2007 – Grade 6 By this definition of functional illiteracy, if students are functionally illiterate they cannot read a short and simple text and extract meaning i.e. they cannot read for meaning
3) In South Africa we have TWO public schooling systems not one
Bimodality – indisputable fact PIRLS/ TIMSS/ SACMEQ/ NSES/ ANA/ Matric… by Wealth/ Language/ Location/ Dept…
Labour Market • University/FET • Type of institution (FET or University) • Quality of institution • Type of qualification(diploma, degree etc.) • Field of study (Engineering, Arts etc.) • High productivity jobs and incomes (17%) • Mainly professional, managerial & skilled jobs • Requires graduates, good quality matric or good vocational skills • Historically mainly white High quality secondaryschool Unequal society High SES background +ECD High quality primary school Minority (20%) Some motivated, lucky or talented students make the transition • Vocational training • Affirmative action • Big demand for good schools despite fees • Some scholarships/bursaries Majority (80%) Quality Type Attainment Low quality secondary school • Low productivity jobs & incomes • Often manual or low skill jobs • Limited or low quality education • Minimum wage can exceed productivity Low SES background Low quality primary school cf. Servaas van der Berg – QLFS 2011
SOLUTION? Accountability AND Capacity
“Only when schools have both the incentive to respond to an accountability system as well as the capacity to do so will there be an improvement in student outcomes.” (p22)
4 “Take-Home” points Many things we have not discussed – Grade-R/ECD, teacher content knowledge, teacher unions, LOLT, teacher training (in- and pre-), RCTs etc. • South Africa performs extremely poorly on local and international assessments of educational achievement. • In large parts of the schooling system there is very little learning taking place. • In SA we have two public schooling systems not one. • Strategies for improvement need to focus on 1) accountability, 2) capacity, 3) alignment.
Thank youComments & Questions?This presentation and papers available online at:www.nicspaull.com/research
Decreasing proportion of matrics taking mathematics Table 4: Mathematics outputs since 2008 (Source: Taylor, 2012, p. 4)
Teacher Content Knowledge • Conference Board of the Mathematical Sciences(2001, ch.2)recommends that mathematics teachers need: • “Athorough mastery of the mathematics in several grades beyond that which they expect to teach, as well as of the mathematics in earlier grades” (2001 report ‘The Mathematical Education of Teachers’) • Ball et al (2008, p. 409) • “Teachers who do not themselves know the subject well are not likely to have the knowledge they need to help students learn this content. At the same time just knowing a subject may well not be sufficient for teaching.” • Shulman (1986, p. 9) • “We expect that the subject matter content understanding of the teacher be at least equal to that of his or her lay colleague, the mere subject matter major”
South Africa specifically… • Taylor & Vinjevold’s (1999, p. 230) conclusion in their book “Getting Learning Right” is particularly explicit: • “The most definite point of convergence across the [President’s Education Initiative] studies is the conclusion that teachers’ poor conceptual knowledge of the subjects they are teaching is a fundamental constraint on the quality of teaching and learning activities, and consequently on the quality of learning outcomes.”
Teacher knowledge Teachers cannot teach what they do not know. Demonizing teachers is popular, but unhelpful • “For every increment of performance I demand from you, I have an equal responsibility to provide you with the capacity to meet that expectation. Likewise, for every investment you make in my skill and knowledge, I have a reciprocal responsibility to demonstrate some new increment in performance” • (Elmore, 2004b, p. 93).
Distribution of mathematics teacher CK by geographical location South Africa is the only country (amongst SACMEQ countries) where rural mathematics teachers know statistically significantly less than urban teachers.
Distribution of mathematics teacher CK by school SES quintile
NSES question 37NSESfollowed about 15000 students (266 schools) and tested them in Grade 3 (2007), Grade 4 (2008) and Grade 5 (2009). Grade 3 maths curriculum: “Can perform calculations using approp symbols to solve problems involving: MULTIPLICATION of at least 2-digit by 1-digit numbers” At the end of Grade 5 more than a third of quintile 1-4 students cannot answer this simple Grade-3-level problem.
Possible solution… • The DBE cannot afford to be idealistic in its implementation of teacher training and testing • Aspirational planning approach: All primary school mathematics teachers should be able to pass the matric mathematics exam (benchmark = desirable teacher CK) • Realistic approach: (e.g.) minimum proficiency benchmark where teachers have to achieve at least 90% in the ANA of the grades in which they teach, and 70% in Grade 9 ANA (benchmark = basic teacher CK) • First we need to figure out what works! • Pilot the system with one district. Imperative to evaluate which teacher training option (of hundreds) works best in urban/rural for example. Rigorous impact evaluations are needed before selecting a program and then rolling it out • Tests are primarily for diagnostic purposes not punitive purposes
Accountability stages... • SA is a few decades behind many OECD countries. Predictable outcomes as we move from stage to stage. Loveless (2005: 7) explains the historical sequence of accountability movements for students – similar movements for teachers? • Stage 1 – Setting standards (defining what students should learn), • CAPS • Stage 2 - Measuring achievement (testing to see what students have learned), • ANA • Stage 3 - Holding educators & students accountable (making results count). • Western Cape performance agreements? Stages in accountability movements: TRAINING • “For every increment of performance I demand from you, I have an equal responsibility to provide you with the capacity to meet that expectation. Likewise, for every investment you make in my skill and knowledge, I have a reciprocal responsibility to demonstrate some new increment in performance” (Elmore, 2004b, p. 93).
When faced with an exceedingly low and unequal quality of education do we…. A) Increase accountability {US model} • Create a fool-proof highly specified, sequenced curriculum (CAPS/workbooks) • Measure learning better and more frequently (ANA) • Increase choice/information in a variety of ways B) Improve the quality of teachers {Finnish model} • Attract better candidates into teaching degrees draw candidates from the top (rather than the bottom) of the matric distribution • Increase the competence of existing teachers (Capacitation) • Long term endeavor which requires sustained, committed, strategic, thoughtful leadership (something we don’t have) C) All of the above {Utopian model} • Perhaps A while we set out on the costly and difficult journey of B??
Way forward? • Acknowledge the extent of the problem • Low quality education is one of the three largest crises facing our country (along with HIV/AIDS and unemployment). Need the political will and public support for widespread reform. • Focus on the basics • Every child MUST master the basics of foundational numeracy and literacy these are the building blocks of further education – weak foundations = recipe for disaster • Teachers need to be in school teaching (re-introduce inspectorate?) • Every teacher needs a minimum competency (basic) in the subjects they teach • Every child (teacher) needs access to adequate learning (teaching) materials • Use every school day and every school period – maximise instructional time • Increase information, accountability & transparency • At ALL levels – DBE, district, school, classroom, learner • Strengthen ANA • Set realistic goals for improvement and hold people accountable
3 biggestchallenges - SA • Failure to get the basics right • Children who cannot read, write and compute properly (Functionally illiterate/innumerate) after 6 years of formal full-time schooling • Often teachers lack even the most basic knowledge • Equity in education • 2 education systems – dysfunctional system operates at bottom of African countries, functional system operates at bottom of developed countries. • More resources is NOT the silver bullet – we are not using existing resources • Lack of accountability • Little accountability to parents in majority of school system • Little accountability between teachers and Department • Teacher unions abusing power and acting unprofessionally
Conclusion • Ensuring that public funding is actually pro-poor and also that it actually reaches the poor. • Understanding whether the motivation is for human dignity reasons or improving learning outcomes. • Ensuring that additional resources are allocated based on evidence rather than anecdote. • The need for BOTH accountability AND capacity.
“The left hand barrel has horizontal wooden slabs, while the right hand side barrel has vertical slabs. The volume in the first barrel depends on the sum of the width of all slabs. Increasing the width of any slab will increase the volume of the barrel. So a strategy on improving anything you can, when you can, while you can, would be effective. The volume in the second barrel is determined by the length of the shortest slab. Two implications of the second barrel are that the impact of a change in a slab on the volume of the barrel depends on whether it is the binding constraint or not. If not, the impact is zero. If it is the binding constraint, the impact will depend on the distance between the shortest slab and the next shortest slab” (Hausmann, Klinger, & Wagner, 2008, p. 17).
NSES question 37NSESfollowed about 15000 students (266 schools) and tested them in Grade 3 (2007), Grade 4 (2008) and Grade 5 (2009). Grade 3 maths curriculum: “Can perform calculations using approp symbols to solve problems involving: MULTIPLICATION of at least 2-digit by 1-digit numbers” Even at the end of Grade 5 more than a third of quintile 1-4 students cannot answer this simple Grade-3-level problem. “The powerful notions of ratio, rate and proportion are built upon the simpler concepts of whole number, multiplication and division, fraction and rational number, and are themselves the precursors to the development of yet more complex concepts such as triangle similarity, trigonometry, gradient and calculus” (Taylor & Reddi, 2013: 194) (Spaull & Viljoen, forthcoming)