NCEP Overview
NCEP Overview. A Briefing to Samuel W. Bodman Deputy Secretary of Commerce And Vice Admiral Conrad C. Lautenbacher, Jr. USN (Ret.) Under Secretary of Commerce for Oceans and Atmosphere By Dr. Louis W. Uccellini Director, National Centers for Environmental Prediction July 2, 2002

NCEP Overview
E N D
Presentation Transcript
NCEP Overview A Briefing to Samuel W. Bodman Deputy Secretary of Commerce And Vice Admiral Conrad C. Lautenbacher, Jr. USN (Ret.) Under Secretary of Commerce for Oceans and Atmosphere By Dr. Louis W. Uccellini Director, National Centers for Environmental Prediction July 2, 2002 NCEP: “Where America’s Climate and Weather Services Begin”
Outline • Mission • Organization • Role within NWS • Examples of Products/Performance • Strategic Issues
NCEP Mission Statement Deliver national and global weather, climate, and water guidance, forecasts, warnings, and analyses to internal and external user communities.
National Weather Service Office of the Assistant Administrator For Weather Services Office of theChief InformationOfficer Office of theChief Financial Officer Eastern Region Central Region Southern Region Western Region Alaska Region Pacific Region National Centers for Environmental Prediction Environmental Modeling Center Hydro- meteorological Prediction Center Storm Prediction Center Tropical Prediction Center (National Hurricane Center) Marine Prediction Center Central Operations Climate Prediction Center Office of Climate, Water, & Weather Services Office of Science & Technology Office of Hydrologic Development Office of Operational Systems Aviation Weather Center Space EnvironmentCenter HQs Field
Severe Storm Outlooks Fire Weather Outlooks Weather Forecasts to Day 7 Quantitative Precipitation Forecasts to 5 days Marine Weather Discussions Model Discussions Severe Weather Watches Hurricane Watches and Warnings Aviation Warnings (Convective, Turbulence, Icing) Climate Forecasts (Weekly to Seasonal to Interannual) Marine High Seas Forecasts Solar Monitoring – geomagnetic storm forecasts What Does NCEP Do? Guidance to Support WFO/RFC National Products • Model Development and Applications, including Data Assimilation • Ocean Models for Climate Prediction; Coastal Ocean Forecast System; Wave Models • Super Computer, Workstation and Network Operations
National Centers for Environmental Prediction $66202.8 K Grand Total:
Central Guidance Local Offices NWS: How We Do It Observe Process Products & Services Respond & Feedback NCEP NCEP Distribute IBM SP at Bowie Computer Center in Bowie, MD Feedback
High Performance Computer • Current IBM SP is 5th most powerful weather supercomputer in the world! • (46X Faster than the Cray C90, 3.0 tflops peak performance) • (The new IBM: 4.9X faster than current IBM SP, 11.4 tflops peak performance, on average over 3 year base period) • 584 nodes with four 375 MHz CPUs each (2336 processors) • (The new IBM: 86 nodes with 32 CPUs each [36 nodes have 1.8 GHz CPUs, 50 nodes have 1.3 GHz CPUs (2752 processors) by June 04) • Ingests over 3.9 million observation reports daily • Produces 100 gigabytes of information daily • NCEP transmits 174,314 model products each day • Supports weather and climate numerical models IBM SP at Bowie Computer Center in Bowie, MD
Global Links • Linking the Global Observing Systems to NCEP Models • The Relationship among Global-Regional-Local Models
Global Observing Systems In situ Radiosondes Aircraft Ships Buoys Surface Remotely sensed GEO LEO GPS/moisture Radar Profilers
NCEP’s Global Forecast System ~75 km Horizontal Resolution 42 Levels
NCEP’s Regional Eta Model 12 km Horizontal Resolution 50 levels
NCEP’s GFDL Hurricane Model Outer Grid 0.5 x 0.5 deg Inner Grid 1/6 x 1/6 deg
NCEP’s GFDL Hurricane Model Outer Grid 0.5 x 0.5 deg Inner Grid 1/6 x 1/6 deg
NCEP’s Wave Watch III Pink – Alaskan 0.5 x .25 deg Yellow – Eastern North Pacific .25 x .25 deg Red – Western North Atlantic .25 x .25 deg Global 1.25 x 1 deg
Hurricane Swells Olga at 11/27/2001 12Z Peak wave period (s) Wave height (m) Olga is far from any land in the deep Atlantic Wind speeds (kt) 13-14 second, swells , 3-4m Substantial deep ocean swells hit the Greater Antilles, in particular Puerto Rico. WFO San Juan reported visual obs. of 12-13s waves at 8-9ft at the beach, together with coastal flooding. http://polar.wwb.noaa.gov/waves
HYSPLIT Dispersion Model • Initialized with winds, temperature, pressure and precipitation from Eta model • HYSPLIT runs are made routinely 4 times per day from 12 km Meso Eta for many locations around the U.S. • Additional requests for runs may be called in to NCEP SDM through WFOs • Special on-demand 4 km support of HYSPLIT available • Lat-lon called into NCEP’s SDM • Normally scheduled HiRes Window run replaced by special 4 km run of Nonhydrostatic Meso Model to 18 hr followed by run of HYSPLIT
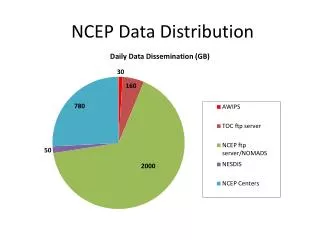
Popularity of Web Page Access to NCEP Models Access introduced July 17, 2001
Who Accesses Our ProductsThrough the Web NCEP Web Page Usage by DomainMay 2001 – April 2002 Average Daily Hits All NCEP Sites
TPC Atlantic 72 hr Track Forecast Errors 700 600 Major Upgrades in Global and Hurricane Numerical models 500 400 Error (nautical miles) 300 200 1987-2000 trendline 1970-1986 trendline 100 0 1970 1980 1990 2000 Year
NCEP GPRA Status 01 Goal 01 Actual 02 Goal 02 so far
Challenges • Climate-Weather-Water linkages • Bridging research to operations • Community modeling • Optimal use of the global observing system • Assimilation of ocean data • Assimilation of satellite and radar data • JCSDA • NOAA Operations and Science Center
Weather Research and Forecast (WRF) Modeling System Ü Develop an advanced mesoscale forecast and assimilation system Ü Promote closer ties between research and operations Context: Design for 1-10 km horizontal grids Advanced data assimilation and model physics Accurate and efficient across a broad range of scales Well-suited for both research and operations Community model support http://wrf-model.org
Computing Capability & Modeling 1993 1998 8 km 80km 32km 2002 2000 Sample coverage of an 8 km grid point 22km 12km
Monthly Web Hits by Center HPC CPC In millions In millions TPC SPC In millions In millions
Hemispheric Global 381 km 1 layer 381 km 3 layer 381 km 6 layer 190.5 km 7 layer ~400km 12L ~155 km 18L ~105 km 18L ~75 km 42L