Download

1 / 30
300 likes | 478 Vues
WHERE IS ALL THE WORLD’S WATER?. GLOBAL HYDROLOGIC STORES. ATMOSPHERE. OCEANS. CONTINENTS. All Blue figures in thousands of Km 3. ATMOSPHERE. 12.9. OCEANS. CONTINENTS. 1,338,000. 47,660. All Blue figures in thousands of km 3. ATMOSPHERE. 12.9. 0.001%. OCEANS. CONTINENTS.

E N D
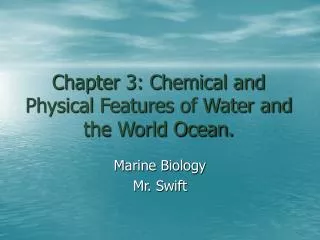
GLOBAL HYDROLOGIC STORES ATMOSPHERE OCEANS CONTINENTS
All Blue figures in thousands of Km3 ATMOSPHERE 12.9 OCEANS CONTINENTS 1,338,000 47,660
All Blue figures in thousands of km3. ATMOSPHERE 12.9 0.001% OCEANS CONTINENTS 1,338,000 47,660 97% 2.999%
Evap. ANNUAL GLOBAL FLUX 577 All Blue figures in thousands of km3. ATMOSPHERE Precip. 12.9 0.001% OCEANS CONTINENTS 1,338,000 47,660 97% 2.999%
Evap. ANNUAL GLOBAL FLUX 577 All Blue figures in thousands of km3. ATMOSPHERE Precip. 12.9 0.001% 23% OCEANS CONTINENTS 1,338,000 47,660 97% 2.999%
Evap. ANNUAL GLOBAL FLUX 577 All Blue figures in thousands of km3. ATMOSPHERE Precip. 12.9 0.001% 23% 77% OCEANS CONTINENTS 1,338,000 47,660 97% 2.999%
Evap. ANNUAL GLOBAL FLUX 577 All Blue figures in thousands of km3. ATMOSPHERE Precip. 12.9 0.001% 16% 23% 77% OCEANS CONTINENTS 1,338,000 47,660 97% 2.999%
Evap. ANNUAL GLOBAL FLUX 577 All Blue figures in thousands of km3. ATMOSPHERE Precip. 12.9 0.001% 16% 84% 23% 77% OCEANS CONTINENTS 1,338,000 47,660 97% 2.999%
Evap. ANNUAL GLOBAL FLUX 577 All Blue figures in thousands of km3. ATMOSPHERE Precip. 12.9 0.001% 16% 84% 23% 77% OCEANS CONTINENTS 1,338,000 47,660 97% 2.999% -7%
Evap. ANNUAL GLOBAL FLUX 577 All Blue figures in thousands of km3. ATMOSPHERE Precip. 12.9 0.001% 16% 84% 23% 77% OCEANS CONTINENTS 1,338,000 47,660 97% 2.999% +7% -7%
Evap. ANNUAL GLOBAL FLUX 577 All Blue figures in thousands of km3. ATMOSPHERE Precip. 12.9 0.001% 16% 84% 23% 77% OCEANS CONTINENTS 1,338,000 47,660 Global Runoff 7% 97% 2.999% +7% -7%
WHAT IS “AVERAGE RESIDENCE TIME”? Volume of Store = $10 bills $ $ $ $ ? $ $ $ $ $ $ Output = $1 bill per day Input = $1 bill per day On average, how many days is the “red” dollar bill likely to stay in the store?
AVERAGE RESIDENCE TIME Volume of Store = $10 bills $ $ $ $ ? $ $ $ $ $ $ Output = $1 bill per day Input = $1 bill per day On average, how many days is the “red” dollar bill likely to stay in the store? 10 days.
AVERAGE RESIDENCE TIME What happens if I increase the number of bills in the store to 20? Volume of Store = $20 bills $ $ $ $ $ $ $ $ ? $ $ $ $ $ $ $ $ $ $ $ $ Output = $1 bill per day Input = $1 bill per day On average, how many days is the “red” dollar bill likely to stay in the store?
AVERAGE RESIDENCE TIME What happens if I increase the number of bills in the store to 20? Volume of Store = $20 bills $ $ $ $ $ $ $ $ ? $ $ $ $ $ $ $ $ $ $ $ $ Output = $1 bill per day Input = $1 bill per day On average, how many days is the “red” dollar bill likely to stay in the store? 20 days!
AS SIZE OF STORE INCREASES • AVERAGE RESIDENCE TIME INCREASES.
AVERAGE RESIDENCE TIME What happens if I increase the rate of inputs and outputs of bills in the store to 10? Volume of Store = $10 bills $ $ $ $ ? ? $ $ $ $ $ $ Output = 2 dollar bills per day Input = 2 dollar bills per day On average, how many days is a “red” dollar bill likely to stay in the store?
AVERAGE RESIDENCE TIME What happens if I increase the rate of inputs and outputs of bills in the store to 10? Volume of Store = $10 bills $ $ $ $ ? ? $ $ $ $ $ $ Output = 2 dollar bills per day Input = 2 dollar bills per day On average, how many days is a “red” dollar bill likely to stay in the store? 5 days!
AS RATES OF INPUTS AND OUTPUTS (AVERAGE FLUX) INCREASE. • AVERAGE RESIDENCE TIME DECREASES.
0.02 yrs 400 yrs 2-3,000 yrs
Kinetic Energy -: By virtue of motion
Potential Energy -: By virtue of position above some datum Increasing Potential Energy 3. 2. 1. Sea –level datum
GRAVITY CONVERTS POTENTIAL TO KINETIC Potential Energy increased by Impounding water behind dam. Raises reservoir level Converted to Kinetic Energy to drive turbines.
Evap. ENERGY IN GLOBAL SYSTEM Release of Kinetic Energy on the Earth’s surface Renewal of Potential Energy via Sun Precip. ATMOSPHERE 12.9 0.001% OCEANS CONTINENTS 1,338,000 47,660 97% 2.999%