Dynamical Invariants from Time Series: Correlation Dimension & Vector Embedding
60 likes | 147 Vues
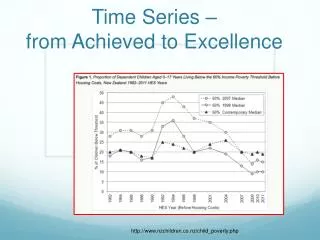
Explore correlation integral estimation, dimension calculation, Theiler's correction, and vector embedding in time series analysis for pattern recognition and feature discriminability. Understand the impact of temporal correlations on estimations and optimal strategies for improving data reconstruction quality.

Dynamical Invariants from Time Series: Correlation Dimension & Vector Embedding
E N D
Presentation Transcript
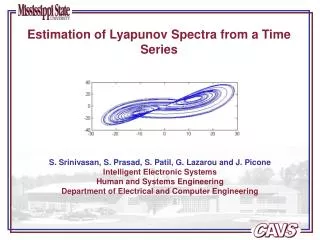
Dynamical Invariants from a Time Series Saurabh Prasad Intelligent Electronic Systems Human and Systems Engineering Department of Electrical and Computer Engineering
Estimating the correlation integral from a time series Correlation Integral of an attractor’s trajectory : Correlation sum of a system’s attractor is a (probabilistic) measure quantifying the average number of neighbors in a neighborhood of radius along the trajectory. where represents the i’th point on the trajectory, is a valid norm and is the Heaviside’s unit step function (serving as a count function here) Correlation Dimension : In the limit that we have an infinitely large data set and a very small neighborhood For small epsilons, the correlation integral is expected to grow exponentially with the true dimension of the attractor Hence,
Correlation Integral and dimension estimation: Practical considerations • Temporal correlations vs. geometric correlations : Choosing neighbors in a small neighborhood about a point forces the inclusion of temporally correlated points • This results in biasing the estimator, yielding a lower dimension estimate • Theiler’s correction : The solution is simple – exclude temporally correlated points from analysis. • ‘w’ – Theiler’s correction factor • An optimal value for w may be found by a space-time separation plot of the data-set.
Fitting the current discussion into the scope of Pattern Recognition Input Time Series (scalar / vector) RPS Higher Order Statistics Lyapunov Spectra K2 Entropy Correlation Dimension Measure discriminability in a space comprised of all possible combinations of these “features”
A note on Vector-Embedding • Vector Embedding: x(t) = [s(t) s(t - t) s(t - 2t) … s(t - (d - 1)t)] x(t) = [s1(t) s2(t)….sm(t) s1(t - t) s2(t - t) ….sm(t - t) … s1(t - (d - 1)t) s2(t - (d - 1)t)…sm(t - (d -1)t)] • It is typically assumed that the delay coordinates chosen are such that components of the embedded vectors are uncorrelated. • For scalar embedding, an optimal choice of t ensures this. • For vector embedding, a strong correlation between components of the (observed) vector stream may hurt the embedding procedure. • PCA/SVD based de-correlation may help remove correlations in second order statistics. • If correlations in higher order statistics of the data stream are removed, it is hoped that it will provide a more meaningful reconstruction.