Mapping our World
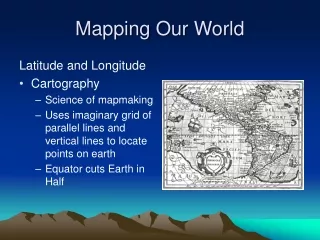
Mapping our World. Introduction. How do you know that maps are accurate representations? Mapping the entire Earth on a flat surface is difficult because of the Earth’s spherical shape. Mapmakers encounter problems producing accurate maps causing distortions. Latitude.

Mapping our World
E N D
Presentation Transcript
Mapping our World Earth Space Science/Mrs. Chason
Introduction • How do you know that maps are accurate representations? • Mapping the entire Earth on a flat surface is difficult because of the Earth’s spherical shape. • Mapmakers encounter problems producing accurate maps causing distortions. Earth Space Science/Mrs. Chason
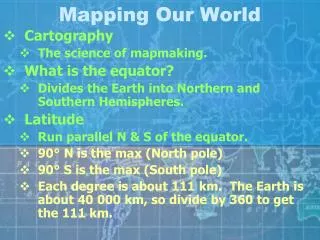
Latitude • Distance in degrees north and south of the equator • Parallels are imaginary lines that circle the world from east to west parallel to the equator. • One degree latitude is 1/360 of Earth’s circumference measured at the poles(111 km or 70 miles) • Each degree of latitude is divided into minutes, 1 degree = 60 minutes (60’) • 1 minute = 1/60 of a degree (1.85 km or 1.15 miles) • Equator=0 degrees • North Pole = 90 degrees north • South Pole = 90 degrees south Earth Space Science/Mrs. Chason
The diagram below shows Earth’s parallels. Earth Space Science/Mrs. Chason
Longitude • Distance in degrees east and west marked with meridians. • Prime meridian is the starting line for the worldwide longitude system and runs through Greenwich, England • Meridians come together at the poles and have no set number of kilometers in a degree. • At equator = 111 km 60° = 55 km 80° = 20 km Earth Space Science/Mrs. Chason
The diagram below shows Earth’s meridians. Earth Space Science/Mrs. Chason
A Great Circle’s plane passes through the center of the sphere or any circle that divides the sphere in half. • Equator is the only line of latitude that is a great circle • Each meridian is ½ great circle. • Great circle routes are the shortest routes between two points on a sphere. Earth Space Science/Mrs. Chason
Finding Direction • One way to find direction on Earth is to use a magnetic compass. • A magnetic compass can indicate direction because Earth has magnetic properties as if a powerful bar-shaped magnet were buried at Earth’s center at an angle to Earth’s axis of rotation. • The areas on Earth’s surface just above where the poles of the imaginary magnet would be are called the geomagnetic poles. • The geomagnetic poles and the geographic poles are located in different places. Earth Space Science/Mrs. Chason
Magnetic Declination • Magnetic declination-difference in the angle between true north & magnetic north. Maps show angle of declination. • The angle between the direction of the geographic pole and the direction in which the compass needle points is called magnetic declination. • In the Northern Hemisphere, magnetic declination is measured in degrees east or west of the geographic North Pole. • Because Earth’s magnetic field is constantly changing, the magnetic declinations of locations around the globe also change constantly. • By using magnetic declination, a person can use a compass to determine geographic north for any place on Earth. Earth Space Science/Mrs. Chason
Global Positioning System • Another way people can find their location on Earth is by using the global positioning system, or GPS. • GPS is a satellite navigation system that is based on a global network of 24 satellites that transmit radio signals to Earth’s surface. • A GPS receiver held by a person on the ground receives signals from three satellites to calculate the latitude, longitude, and altitude of the receiver on Earth. Earth Space Science/Mrs. Chason
Time Zones Earth Space Science/Mrs. Chason
Time Zones • Each time zone is 15° wide, corresponding roughly to lines of longitude. • Time zone boundaries have been adjusted in local areas for convenience. Earth Space Science/Mrs. Chason
There are six different time zones in the United States. Earth Space Science/Mrs. Chason
Calendar Dates • Every time zone experiences this transition from one day to the next, with the calendar advancing to the next day at midnight. • Each time you travel through a time zone, you gain or lose time, eventually gaining or losing an entire day. • The International Date Line, or 180° meridian, serves as the transition line for calendar days. • Traveling west across the International Date Line, you would advance your calendar one day. • Traveling east, you would move your calendar back one day. Earth Space Science/Mrs. Chason
How Scientists Make Maps • Because most globes are too small to show details of Earth’s surface, such as streams and highways, a great variety of maps have been developed for studying and displaying detailed information about Earth. • The science of making maps is called cartography. Scientists who make maps are called cartographers. • Cartographers use data from a variety of sources, such as from field surveys and remote sensing. • Field survey-survey team collects data on ground • remote sensing the process of gathering and analyzing information about an object without physically being in touch with the object. Use airplanes and satellites. Use radar, more detailed and accurate. • Photogrammetry-aerial photos • Imaging radar-radar signal, not effected by cloud cover. Computers turn data into images. • Landsat-optical satellite using solar energy • Computer imaging-makes maps from data collected by imaging radar. Earth Space Science/Mrs. Chason
Map Projections • A map is a flat representation of Earth’s curved surface. • Transferring a curved surface to a flat map results in a distorted image of the curved surface. An area shown on a map may be distorted in size, shape, distance, or direction. • Over the years, cartographers have developed several ways to transfer the curved surface of Earth onto flat maps. These methods are called map projections. • map projection a flat map that represents a spherical surface • No map projection is entirely accurate, but each kind of projection has advantages and disadvantages. Earth Space Science/Mrs. Chason
Accurate Map Projections • Map projection is a method of showing curve on a plane. It shows the curved Earth (3-D) on a flat surface. • The larger the area being shown is the greater the distortion. • Ideal maps will show shapes, distances, and directions correctly. • There are three types of map projections. Earth Space Science/Mrs. Chason
US Geological Survey • Federal agency that produces topographic maps • Quadrangles-map with standard boundaries. Described by latitudes and longitudes. • Map series-family of maps conforming to same specifications such as scale. 7.5 minute quadrangle-scale 1:24 000 7.5 minutes longitude and latitude Earth Space Science/Mrs. Chason
Mercator (Cylindrical) • If you wrapped a cylinder of paper around a lighted globe and traced the outlines of continents, oceans, parallels, and meridians, a cylindrical projection would result. • Most famous is Mercator named for Gerhard Mercator, a 16th century Flemish cartographer and geographer. • Parallels & meridians form a grid; Meridians-straight, parallel, evenly spaced • Shows true direction in straight lines • Distorts distance at high altitudes • A cylindrical projection is accurate near the equator but distorts distances and sizes near the poles.. • On a cylindrical projection, shapes of small areas are usually well preserved. Earth Space Science/Mrs. Chason
Gnomonic (Azimuthal) • A projection made by placing a sheet of paper against a globe such that the paper touches the globe at only one point is called an azimuthal projection. • Shows shortest route between two points on Earth correctly. • Direction and distances are distorted. • On an azimuthal projection, little distortion occurs at a the point of contact, but the unequal spacing between parallels causes a distortion in both direction and distance that increases as distance from the point of contact increases. • One advantage of azimuthal projections is that on these maps, great circles appear as straight lines. Thus, azimuthal projections are useful for plotting navigational paths. Useful in planning long airplane flights and ocean trips Earth Space Science/Mrs. Chason
Conic • A projection made by placing a paper cone over a lighted globe so that the axis of the cone aligns with the axis of the globe is known as a conic projection. • Areas near the parallel where the cone and the globe are in contact are distorted least. • A series of conic projections can be used to increase accuracy by mapping a number of neighboring areas and fitting the adjoining areas together to make a polyconic projection. • On a polyconic projection, the relative sizes and shapes of small areas on the map are nearly the same as those on the globe. • Shape and size of landforms accurate • Useful in making topographic maps • Lines of latitude and longitude have slight curve Earth Space Science/Mrs. Chason
Reading a Map • Maps provide information through the use of symbols. Direction on a Map • Maps are commonly drawn with north at the top, east at the right, west at the left, and south at the bottom. • Some maps use parallels of latitude and meridians of longitude to indicate direction and location. • Many maps also include a compass rose, which is a symbol that indicates the cardinal directions (north, east, south, and west), or an arrow that indicates north. Earth Space Science/Mrs. Chason
Symbols • Symbols are commonly used on maps to represent features such as cities, highways, rivers, and other points of interest. • Symbols may resemble the features that they represent, or they may be more abstract. • Symbols are commonly explained in a legend. • legend a list of map symbols and their meanings Earth Space Science/Mrs. Chason
Map Scales • scale - the relationship between the distance shown on a map and the actual distance • Map scales are commonly expressed as graphic scales, fractional scales, or verbal scales. • A graphic scale is a printed line that has markings that represent units of measure, such as meters or kilometers. • A fractional scale is a ratio that indicates how distance on Earth relates to distance on the map. • A verbal scale expresses scale in sentence form. Earth Space Science/Mrs. Chason
Map Scales • 3 ways of expressing map scales: 1. Verbal-measured with ruler (1 cm to 50 km) 2. Graphic-lines divided into parts-measured with straightedge or string (I----------I 1km) 3. Fractional (Numerical-representative fraction) (1:1,000,000) • Large-scale shows more detail of small area • Small-scale shows less detail of large area. Earth Space Science/Mrs. Chason
Isograms • Represents a line of equal value • Isotherm-temperature • Isobars-atmospheric pressure • Also precipitation, gravity, magnetism, density, elevation. Earth Space Science/Mrs. Chason
Topographic Maps • One of the most widely used maps is called a topographic map, which shows the surface features of Earth. • topography - the size and shape of the land surface features of a region • elevation - the height of an object above sea level Advantages of Topographic Maps • Topographic maps provide more detailed information about the surface of Earth than drawings. Earth Space Science/Mrs. Chason
Elevation on Topographic Maps • On topographic maps, elevation is shown by using contour lines. • contour line - a line that connects points of equal elevation on a map • The difference in elevation between one contour line and the next is called the contour interval. The contour interval is selected based on the relief of the area being mapped. • relief - the difference between the highest and lowest elevations in a given area • Every fifth contour line is darker than the four lines on either side of it. This index contour makes reading elevation easier. Earth Space Science/Mrs. Chason
The diagram below shows how topographic maps represent landforms. Earth Space Science/Mrs. Chason
Depression Contour Lines • Depression contour lines are used to represent features that are lower than the surrounding area Earth Space Science/Mrs. Chason
Mapping a Mountain Mapmakers use different methods to represent the shape of the land surface on maps. The most common method uses lines called contours, which are drawn to connect points at the same elevation above sea level. The maps on which contour lines appear are called contour maps or topographic maps. Objective: To describe the shape of a land surface using a contour map. Procedure: Take the lid off of the box and pour the water out being careful not to get the lid wet. Place a piece of printer paper on top of the lid, hold up to the light, and trace the contour lines with a pencil. Label the line drawn for the base of the mountain “0” for sea level. Then label the elevation of each of the other contour lines. Complete your map by adding the contour interval, map title, your name and the date. Analysis: 1. Select any line drawn around the mountain on your map. What is true of the elevation of every point along this line? 2. Why is the line around the base of your mountain a contour line? 3. What is the difference in elevation between the highest and lowest contour lines? 4. On which side of the mountain are the contour lines closer together? Earth Space Science/Mrs. Chason
Reading a Topographic Map • Shows changes in elevation of Earth’s surface • Maps show direction with parallels and meridians • Determine compass direction (compass rose) • Legend-explain symbols • Use one of the map scales Earth Space Science/Mrs. Chason
Landforms on Topographic Maps • The spacing and direction of contour lines indicate the shapes of the landforms represented on a topographic map. • Closely spaced contour lines indicate that the slope is steep. • Widely spaced contour lines indicate that the land is relatively level. • A contour line that bends to form a V shape indicates a valley. The bend in the V points toward the higher end of the valley; this V points upstream, or in the direction from which the water flows, if there is a stream. • Contour lines that form closed loops indicate a hilltop or a depression. Closed loops that have short straight lines perpendicular to the inside of the loop indicate a depression. Earth Space Science/Mrs. Chason
Contours for Elevation • Relief (highs and lows) can be shown by shading, coloring, or miniature sketching of landforms. • Contour lines-lines drawn to connect points at the same elevation. • show relief on topographic maps • show elevation • shape of the land • steepness of slopes • shape at various heights. • Contour interval is the difference in elevation between two consecutive lines. Earth Space Science/Mrs. Chason
Topographic Map Symbols • Symbols are used to show certain features on topographic maps. • Symbol color indicates the type of feature. • Constructed features, such as buildings, are shown in black. • Highways are shown in red. • Bodies of water are colored blue. • Forested areas are colored green. • Contour lines are brown or black. Earth Space Science/Mrs. Chason
Benchmark & Symbols • Permanent plate showing exact elevation of site • Brass or aluminum plate set in ground • Marked with BM on maps • No BM shown by + elevation • Spot/special elevations (lakes,fork in road) shown by small cross • Numbers by surveyors-black • Unchecked-brown • Water elevations-blue Earth Space Science/Mrs. Chason
Gradient • Gradient-average slope between two points of a hill, mountain, river, trail, road. • Average slope= change in elevation (ft.) distance (miles) • Profile-shows relief of land. Made on vertical scale by plotting points where contours cross profile. Make different elevations more visible. Earth Space Science/Mrs. Chason
Geologic Maps • Geologic maps are designed to show the distribution of geologic features, such as the types of rocks found an a given area and the locations of faults, folds, and other structures. Earth Space Science/Mrs. Chason
Soil Maps • Scientists construct soil maps to classify, map, and describe soils, based on surveys of soils in a given area. • Soil maps are valuable tools for agriculture and land management. • Soil maps are used by farmers, agricultural engineers, and government agencies. • The information in soil maps and soil surveys helps developers and agencies identify ways to conserve and use soil and plan sites for future development. Earth Space Science/Mrs. Chason