Exploring Cartography: Methods and Techniques for Mapping Our World
This text delves into the fascinating field of cartography and the various methods utilized by scientists to create maps of our planet. By inspecting the use of latitude and longitude, we explore time zones and the International Date Line. We also discuss types of maps, including Mercator, conic, and gnomonic projections, as well as topographic maps that highlight specific geographical features. Additionally, we touch on remote sensing technology, the electromagnetic spectrum, and the importance of map scales and legends in understanding spatial relationships.

Exploring Cartography: Methods and Techniques for Mapping Our World
E N D
Presentation Transcript
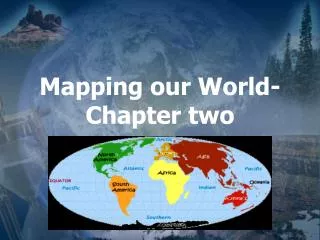
Mapping Our World We will investigate several methods scientists use to map our world. The goal of creating any map is to be able to locate and obtain information about one specific and unique place. Maps allow use to obtain information visually.
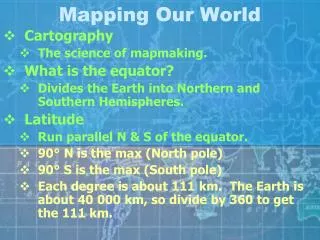
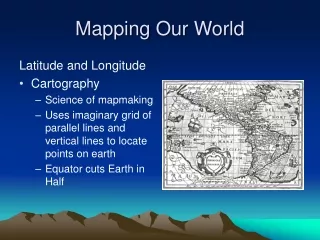
Cartography – the science of map making. • A grid of imaginary parallel and vertical lines allows cartographers to make maps with unique points.
Latitude and Longitude • Latitude – lines running parallel to the equator. • Longitude – lines running from the north pole to the south pole.
Time Zones • Time Zones – the Earth is divided into 24 time zones. Why?
International Date Line – also known as the 180° meridian and serves as the transition line for calendar days.
Types of Maps • Maps are flat 2-dimensional models of a 3-dimensional Earth. • The shape or area of landmasses on a map can be distorted because a 2-D map is trying to represent a 3-D surface.
Types of Maps • Mercator Projections – a map that has parallel lines of latitude and longitude. • Conic Projections – a map that is made by projecting points and lines from a globe onto a cone. The cone touches the globe at a particular line of latitude.
Types of Maps • Gnomonic Projections – a map that is made by projecting points and lines from a globe onto a piece of paper that touches the globe at a single point. • Topographic Maps – a detail map showing hills, valleys, and other features of a specific area.
Topographic Maps • Contour lines • Contour Intervals • Index Contours • Depressions Contours
Map Legends – explains what symbols represent on a map. • Map Scale – the ratio between the distance on the map and the actual distance on the surface of the Earth. There are three main types of scales.
3 Types of Map Scales • Verbal Scales • Graphic Scales • Fractional Scales
Remote Sensing • Most maps have been made by collecting data on-site, but recently technology has allowed maps to be made from data collected at great distances. • The process of collecting data about the Earth from far above the Earth’s surface is called remote sensing. • Satellites will do most of the remote sensing of the Earth.
How do satellites collect data? The Electromagnetic Spectrum • Energy is received and transmitted from the Earth through electromagnetic waves. • Different types of waves have different properties, such as different wavelengths and frequencies.
Types of electromagnetic radiation: • Radio waves • Microwaves • Infrared radiation • Visible light • Ultraviolet radiation • X-rays Gamma rays
Wave Characteristics • All electromagnetic waves travel at 300,000 km/s is a vacuum (the speed of light) • Wavelength - the distance between waves (meters)…from peak to trough. • Frequency - the number of waves that pass a particular point each second.