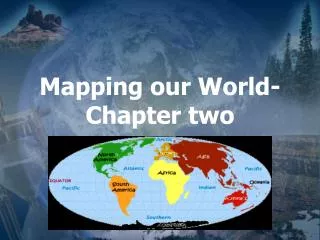
Understanding Latitude, Longitude, and Mapping Techniques: A Guide to Cartography
This guide explores the fundamentals of cartography, emphasizing latitude and longitude for precise global positioning. It covers the significance of the Equator and Prime Meridian in defining hemispheres, the structure of time zones, and the International Date Line. Various map types are introduced, including Mercator, Conic, Gnomonic, and topographic maps, each with its unique characteristics. Additionally, it delves into remote sensing technologies and GPS, crucial for modern mapping practices. Discover how the Earth’s surface is represented and navigated through maps.

Understanding Latitude, Longitude, and Mapping Techniques: A Guide to Cartography
E N D
Presentation Transcript
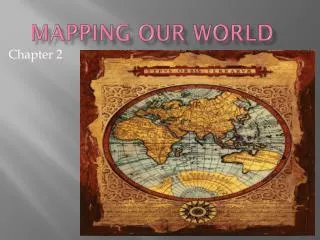
2.1 Latitude and Longitude Mapping our world
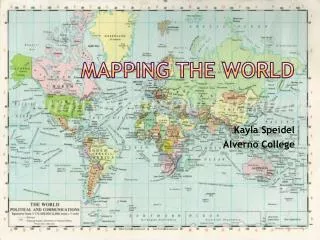
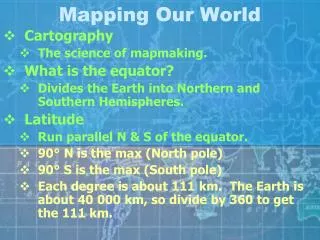
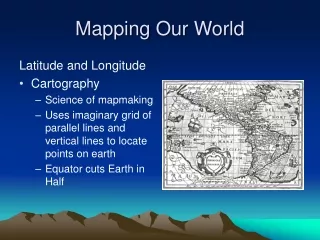
Cartography- science of map making • Uses imaginary gridlines to locate exact points on Earth • The Equator separates the N and S hemispheres • The Prime Meridian separates the W and E hemispheres
Latitude • Run parallel to the Equator • The Equator is 0o latitude • The poles are located at 90o N and 90o S
Longitude • Semicircles that extend pole to pole • The Prime Meridian is 0o longitude • Points west are numbered 0o-180o W • Points east are numbered 0o-180o E
Time Zones • There are 24 time zones on Earth • Approx. 15o wide • Some time zone boundaries may be shifted in order to make it more convenient locally
Calendar Dates • The International Date Line is located at the 180o meridian • Traveling west across the International Date Line, you would move into tomorrow • Traveling east across the International Date Line, you would move into yesterday
2.2 Types of Maps Mapping our world
Maps- flat projections of a 3D Earth • Mercator Projection • Parallel lines of latitude and longitude • Landmasses near poles are exaggerated
Conic Projection • Projects points and lines from a globe onto a cone • Distorts at top and bottom • Very accurate for small maps • Used for making road and weather maps
Gnomonic Projection • Makes Great Circles • Distort land and distance • Shortest distance between two points • Useful for plotting long distance air and sea travel
Topographic Maps • Detailed maps showing hills and valleys • Show changes in elevation • Mountains • Rivers • Forests • Etc…
Topographic Maps • Contour Lines • Connect points of equal elevation • Never cross • Contour Intervals • Steeper terrain will have closer lines or larger intervals • See Index Contours
Depression Contour Lines • Distinguish areas of lower elevation than the surrounding terrain • Volcanic craters • Mines • Sinkholes
Map Legends and Scales • Map Legends • Explanation of symbols found on a map • Map Scales • Ratio between the distances on a map and actual distances on the surface of the Earth • May be graphic or verbal
2.3 Remote Sensing Mapping our world
Remote Sensing • The process of collecting data about Earth from far above Earth’s surface
Electromagnetic Spectrum • Satellites detect different wavelengths of energy reflected or emitted from Earth’s surface Visible light, gamma rays, X rays, UV rays, infrared rays, radio waves, and microwaves
Landsat Satellites • Use visible light and infrared radiation to map Earth’s surface • This picture shows how the Texas coast was scarred by Hurricane Ike
Global Positioning System (GPS) • Radio-navigation system of at least 24 satellites • Allows users to determine exact position on Earth
Sea Beam • Relies on sonar to map ocean floor • Uses sound waves to detect and measure objects under water • Sound waves are sent out and a receiving device picks up the echo and calculates the distance