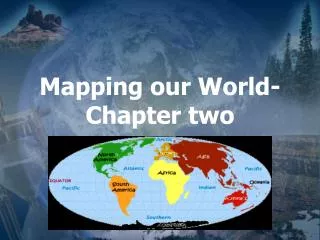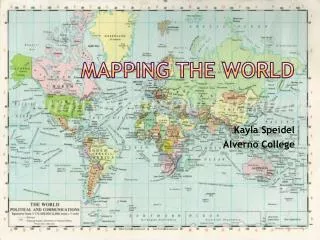
Understanding Cartography: Mapping the Earth through Latitude, Longitude, and Technologies
Explore the science of cartography and learn about the Earth's geography, including the equator, latitude, and longitude. Discover how distances are measured in degrees, minutes, and seconds, and how time zones and the International Date Line work. Learn about different types of maps, such as Mercator, Conic, Topographic, and Gnomonic projections. Delve into map legends, scales, and the role of remote sensing technologies that enhance our understanding of Earth through satellite imagery and GPS navigation systems.

Understanding Cartography: Mapping the Earth through Latitude, Longitude, and Technologies
E N D
Presentation Transcript
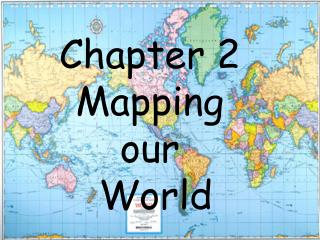
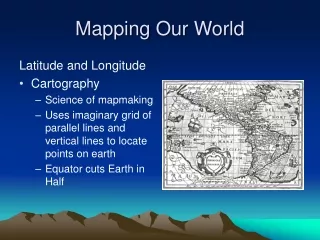
Mapping Our World Cartography The science of mapmaking. What is the equator? Divides the Earth into Northern and Southern Hemispheres. Latitude Run parallel N & S of the equator. 90° N is the max (North pole) 90° S is the max (South pole) Each degree is about 111 km. The Earth is about 40 000 km, so divide by 360 to get the 111 km.
The degrees can be broken down into minutes (’), which are 60 units smaller than degrees. One minute is 1.85 km, take 111 km divided by 60 to get this. Minutes can be broken down into seconds (”), which are 60 units smaller than minutes. Longitude Runs through Greenwich, England. Distance in degrees E or W of the prime meridian. Longitude is also divided into degrees, minutes, and seconds.
Line of longitude are not parallel to one another like latitude are. Each longitude line connects to the N & S poles. Example: Fig. 2-3 (pg. 30) New Orleans 29°57’ N & 90°04’ W Time Zones Why 24? Fig. 2-4 (pg.30) Fig. 2-5 (pg. 31) International Date Line (180° meridan) This is the transition line for calendar days. If you travel West of it you gain a calendar day and if you travel East you lose a day.
Types of Maps 1. Mercator Projection – this map has parallel lines of latitude and longitude. The landmass are the correct shapes, but distorted. Ex. Greenland appears larger than Australia. Used for planes and ships Conic Projection – this map projects points and lines from a globe onto a cone. There is less distortion except at the top and bottom. Used for road maps and weather maps.
4. Topographic Maps – used to show changes in elevation on the Earth’s surface. 3. Gnomonic Projection – the projection points and lines from a globe are placed onto a piece of paper that touches the globe at a single point Fig. 2-8 (pg.33) This map distorts direction and distance, but they are useful in plotting long-distance trips by air and by sea. Shows detail for hills and valleys in an area. The change in elevation is shown with contour lines.
Contour lines never cross. The lines connect points of equal elevation. The difference in elevation between two side-by-side contour lines are contour intervals. Ex. If the contour intervals are close together that means a steep elevation increase. Fig. 2-9 (pg. 34) Index contours are used as marked numbers to represent the distance in an increase or decrease of elevation. Most index contours are 5m or 10m.
To show depression contour lines (decrease in elevation), a short line at right angles to the contour line is used. These are called hachures. Fig. 2-10 (pg. 34) Map Legends Used to explain the symbols used for representation. Fig. 2-11 (pg. 35) Map Scales Used as a ratio between distances on a map and actual distances on the surface of Earth. The 3 types are verbal, graphic, and fractional.
The verbal scale is represented by expressed distances. Ex. One cm = One km The graphic scale uses a line that represents a certain distance, such as 10 miles or 10 km. The line used could be broken down into sections. The fractional scale shows distance as a ratio. Ex. 1:2,847,000 or 1inch = 45 miles A large ratio represents a large area and a small ratio represents a small area. Fig. 2-12 (pg. 36)
Remote Sensing With new technology scientists are able to use remote sensing to map the Earth’s surface. Electromagnetic Spectrum All electromagnetic waves travel at 300 000 km/s in a vacuum. What are the electromagnetic waves? Radio, microwaves, infrared, visible, U.V., x-rays, gamma. Landsat Satellites Use receives wavelengths of energy from Earth (mainly visible & infrared). Fig. 2-15 (pg.38)
Topex/Poseidon Satellite It uses high-frequency radar to map the ocean floor. Fig. 2-16 (pg. 39) Global Positioning System (GPS) A radio-navigation system used to determine exact positions on Earth. There are over 24 satellites that orbit the Earth. They use a high-frequency microwave to pick up transmissions from the GPS unit. GPS units calculate exact longitude and latitude, along with elevation, speed, and direction of the unit.