Classification of the channel output (Readout electronics test):
10 likes | 168 Vues
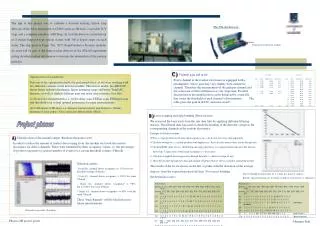
2T module. 3T module. Chip. Gain. Output Noise. Input Noise. Chip. Gain. Output Noise. Input Noise. 1. 52,50. 28,00. 0,53. 1. 52,60. 22,00. 0,42. 2. 51,00. 27,00. 0,53. 2. 50,50. 20,00. 0,40. 3. 53,00. 28,00. 0,53. 3. 50,75. 20,00. 0,39. 4. 50,00. 24,50. 0,49.

Classification of the channel output (Readout electronics test):
E N D
Presentation Transcript
2T module 3T module Chip Gain Output Noise Input Noise Chip Gain Output Noise Input Noise 1 52,50 28,00 0,53 1 52,60 22,00 0,42 2 51,00 27,00 0,53 2 50,50 20,00 0,40 3 53,00 28,00 0,53 3 50,75 20,00 0,39 4 50,00 24,50 0,49 4 54,00 20,75 0,38 5 53,00 20,50 0,39 6 54,25 28,00 0,52 6 50,00 20,75 0,42 7 52,75 30,00 0,57 7 52,60 20,80 0,40 8 50,75 20,00 0,39 9 52,50 21,25 0,40 10 52,00 21,00 0,40 11 52,40 21,25 0,41 12 54,30 22,50 0,41 mean 52,26 27,48 0,53 mean 50,72 20,80 0,41 The aim of this project was to calibrate a forward tracking silicon strip detector of the Atlas experiment at CERN using an IR-laser, a movable X-Y stage and a computer interface (ABCDaq). In total the detector constisted out of 4 wedge-shaped n-type silicon wafers with 768 p-doped strips on each wafer. The strip pitch is 80mm. The SCT (SemiConductor Tracker) modules we used will be part of the Inner tracker detector of the ATLAS experiment giving detailed position information to measure the momentum of the passing particles. The ATLAS detector: Position of our detector module Channel gain and noise: Every channel in the readout electronics is equipped with a preamplifier, whose gain may vary slightly from channel to channel. Therefore the measurement of the gain per channel and the correction of these differences is very important. Possible fluctuations in the amplification can be balanced by a trim file that varies the threshold of each channel‘s discriminator. The table gives the gain in mV/fC and noise in mV Optimisation of parameters: Part one of the optimisation had to be performed twice, as we were working with two different versions of the detector module. The newest model, the ABCD3T, shows better radiation hardening, larger trimming range and better TrimDAC linearity, as well as slightly different gain and noise characteristics (see left). (i) Several test measurements,i.e. strobe delay scan, FEBias scan, FEShaper scan and threshold scan to find optimal parameters for main measurements (ii) Calibration of IR-laser, i.e. distance between laser and detector (12mm), duration of laser pulse (15ns) and laser driver delay (80ns) • Laser scanning and chip bonding (Detector test): • We extracted the laser track from the raw data files by applying different filtering macros. This filtered data was used to check the bonding of the detector‘s strips to the corresponding channels in the readout electronics. • Example of filtration routine: • Plot x-y-stage position on X-axis and occupancy (occ.) on Y-axis for every strip separately • Calculate average occ.; exclude position with highest occ. & recalculate mean value; iterate this process • Calculate RMS value for occ. distibution and copy only those x-y-stage positions into new file that are • more than 5 sigma away from mean occupancy (-> laser spot) • 4. Calculate weighted linear regression through data file -> values for slope & axis • 5. Draw this fit line through raw data and exclude all points that lie out of a corridor around the fit line • The results of the fit are shown on the left, together with the deviation of the average • strip no. from the expected position (fit line). For correct bonding • the deviation is zero ! Classification of the channel output (Readout electronics test): In order to reduce the amount of useless data coming from the module we tested the readout electronics for defect channels. These were identified by their occupancy values, i.e. the percentage of positive responses to a preset number of events for a certain threshold voltage (Vthresh). Selection criteria: - Dead (D): channel shows occupancy <= 1% for every threshold voltage (Vthresh) - Over (O): channel shows occupancy > 100% for some Vthresh - Stuck (S): channel shows occupancy > 98%, but <= 100% for every Vthresh - Under (U): channel shows occupancy <= 98% even for small Vthresh These “bad channels“ will be blocked out in future measurements. Top: fit through measured data, X: x-y-stage pos [µm], Y: strip no. Bottom: spread histogram, X: deviation of strip no. from fit line, Y: abundance Filtered data: points 0 100 200 300 400 500 600 700 800 900 1000 1100 1200 1300 … events 572 557 565 559 565 567 562 574 573 563 565 558 574 563 … 32 0 1 0 0 0 0 0 0 0 2 0 0 0 25 48 15 0 0 0 0 0 0 0 0 0 0 0 0 0 33 0 1 0 0 0 0 0 1 0 2 0 0 0 50 7 0 0 0 0 0 0 0 0 0 0 0 0 0 0 32 3 3 3 1 2 1 0 3 2 1 5 1 36 40 9 0 5 0 0 1 2 1 2 1 1 2 0 1 2 3 35 1 1 3 1 2 3 3 1 2 1 2 36 41 9 3 3 3 4 1 0 3 1 3 0 2 2 1 3 2 0 36 5 0 2 4 4 1 5 2 10 52 52 19 6 4 7 5 9 5 3 3 5 4 6 5 4 3 7 5 9 61 534 ... 505 525 541 524 522 510 542 498 516 515 538 511 508 514 103 0 0 0 0 0 0 0 0 0 0 0 0 0 0 0 0 0 0 0 0 0 0 0 0 0 0 0 0 0 0 0 Filtered data: points 0 100 200 300 400 500 600 700 800 900 1000 1100 1200 1300 … events 572 557 565 559 565 567 562 574 573 563 565 558 574 563 … 32 0 0 0 0 0 0 0 0 0 0 0 0 0 25 48 15 0 0 0 0 33 0 0 0 0 0 0 0 0 0 2 0 0 0 50 7 0 0 0 0 0 34 0 0 0 0 0 0 0 0 0 1 5 1 36 40 9 0 0 0 0 0 (correctly bonded) 35 0 0 0 0 0 0 0 1 2 1 2 36 41 0 0 0 0 0 0 0 36 0 0 0 0 0 0 0 5 2 10 52 52 19 0 0 0 0 0 0 0 61 0 ... 0 0 0 541 510 511 544 498 523 0 0 0 (high noise !) 103 0 0 0 0 0 0 0 0 0 0 0 0 0 0 0 0 0 0 0 0 (dead channel) Threshold scan of the 3T module Physics 4H project poster Johannes Fink