Classical Psychophysical Methods: Understanding Perception Through Sensory Thresholds
Explore the study of sensation and perception through classical psychophysical methods to understand how the brain processes and reconstructs physical reality. Dive into historical research, theories, and empirical techniques to uncover the intricate relationship between stimuli and sensory capabilities.

Classical Psychophysical Methods: Understanding Perception Through Sensory Thresholds
E N D
Presentation Transcript
Sensation & Perception Lecture 2: Psychophysical Methods Andy Clark September 29, 2004
Administrative • E-mail: • See the website for emailing details if you are a person • Go away if you are a spam robot
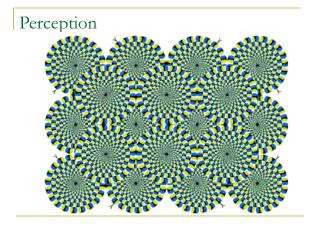
Review… • Large percentage of brain (subcortical/cortical) devoted to perceptual processing • Perception is (re) construction of physical reality • Instances in which perception does not correspond to reality (illusions) provide useful insight into structure of system
Phenomenology • Philosophical Movement • Study of structures of experience (consciousness) • OBSERVATIONAL • SUBJECTIVE • LACKS FIRM MEASURE
Psychophysics • Study of the relationships between physical energy and sensory capabilities • Weber (1834) • Fechner (1860) After Descartes, 1644
C A B Perception Processing recognition Action Transduction Stimulus on receptors Environmental Stimulus Attended Stimulus
Levels of Analysis • A (stimulus-perception) • Psychophysics • Classical methods, Magnitude Estimation, TSD • B (stimulus-processing) • Physiology (extra- & intracellular recordings) • C (physiology-perception) • fMRI, awake-behaving monkeys
Classical Psychophysical Methods • Grew out of research into Absolute Detection • Absolute Detection-description of sensory events in terms of the minimum amount of stimulus energy required to elicit them • i.e. dimmest visible light • ‘sensory threshold’
Classical Psychophysical Theory • Sensory Threshold • Herbart (1824) critical boundary, above which neural activity signals the presence of a sensory event –ABSOLUTE
Psychophysical Theory • Threshold is a statistical concept, affected by: • Chance variation in the nervous system • Intensity of signal • Observer’s criterion
Method of Limits • Example: Visual Detection Thresholds • Begin experiment by showing subject a dim light • Slowly raise luminance until subject indicates detection • Start over by initially displaying bright light • Slowly lower luminance until subjects can’t detect
Start Y Y Y Y N N N N Start Method of Limits * * Etc. etc…
Method of Limits • Threshold=Mean of ‘crossover’ values
Method of Adjustment • Subject able to manipulate value of stimulus parameter of interest (brightness in our example) • Lower/Raise until just barely detectable • Repeat # of times, average values to estimate threshold
Problems ? • Yes Hysteresis • “path dependence” • Ex. Method of Limits • Threshold value will differ dependent upon whether experimenter started with: dimbright brightdim
Method of Constant Stimuli • Create stimulus set a priori • Value of parameter of interest varies slightly throughout set
Method of Constant Stimuli • Display stimuli in random order • For each trial subject indicates their perception (i.e. yes/no for detection case) • Plot subjects responses as probability of detection versus stimulus value • Threshold = value for which subject detects stimulus on 50% of the trials
Method of Constant Stimuli 1 .5 % “Yes” responses 0 luminance
Method of Constant Stimuli 1 Psychometric function Extract 2 measures: % “Yes” responses • Absolute Threshold 0 luminance
Method of Constant Stimuli 1 Psychometric function Extract 2 measures: % “Yes” responses 2. “Sensitivity” (slope) 0 luminance
Sensitivity • Weber (1834) • Measure the smallest detectable change in stimulus energy • Just Noticeable Difference (JND) • Worked with discrimination of lifted weights • Studied relationship between JND for intensity and base intensity level
Sensitivity • Weber’s Law • JND=S*K or JND/S=K • Where S=value of standard, K=Weber’s constant, JND=just noticeable difference • Increases in intensity that are just noticeably different to an observer are constant fraction of stimulus intensity • Holds for suprathreshold stimuli
Sensitivity • Ex. Brightness % Yes Responses (Q=Stimuli Different?) Brightness
Magnitude Estimation • Observer rates stimuli in relation to some stimulus standard • Ex. Brightness • Observer rates standard light with Brightness of 10 • Successive estimations proportional to standard light twice as bright – 20 half –5 etc. etc.
Magnitude Estimation Shock Line length • Response expansion Brightness • Response compression
Magnitude Estimation • Steven’s Power Law P=perceived magnitude, K=constant, S=stimulus intensity When estimates plotted on log/log scale, functions become linear, exponent determines the slope