Download
1 / 42
420 likes | 439 Vues
Fossil Fuels. Our fantastic flash in the pan. A brief history of fossil fuels. Here today, gone tomorrow What will our future hold? Will it be back to a simple life? Or will we find new ways to produce all the energy we want? Or will it be somewhere in the middle. Finding Oil.

E N D
Fossil Fuels Our fantastic flash in the pan
A brief history of fossil fuels • Here today, gone tomorrow • What will our future hold? • Will it be back to a simple life? • Or will we find new ways to produce all the energy we want? • Or will it be somewhere in the middle
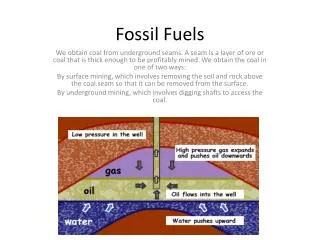
Finding Oil • Oil is trapped in special (rare) geological structures • Most of the oil in the world comes from a few large wells • About one in ten exploratory drillings strike oil • and this in places known to be oil-rich: get nothing in most of world Q
The Oil Window • Organic material must be deposited without decomposing • oxygen-poor environment: usually underwater with poor flow • Material must spend time buried below 7,500 feet of rock • so that molecules are “cracked” into smaller sizes • But must not go below 15,000 feet • else “cracked” into methane: gas, but no oil • So there is a window from 7,500 to 15,000 feet • Additional circumstances must be met • existence of “caprock” to keep oil from escaping: even a drop per second depletes 20 million barrels per million years • source rock must be porous and permeable to allow oil flow • Oil is not in underground lakes—more like soaked sponges
The hydrocarbons kJ per gram • All fossil fuels are essentially hydrocarbons, except coal, which is mostly just carbon • Natural Gas is composed of the lighter hydrocarbons (methane through pentane) • Gasoline is hexane (C6) through C12 • Lubricants are C16 and up 55 48 48 51 50 48 46 48 48 48
Hydrocarbon Reactions • Methane reaction: CH4 + 2O2 CO2 + 2H2O+ energy 1 g4 g2.75 g2.25 g55 kJ • Octane reaction: 2C8H18 + 25O2 16CO2 + 18H2O+ energy 1 g3.51 g3.09 g1.42 g48 kJ • For every pound of fuel you burn, you get about three times that in CO2 • one gallon of gasoline ~20 pounds of CO2 • occupies about 5 cubic meters (1300 gallons) of space Q2
Aside: Carbohydrate Reactions • Typical carbohydrate (sugar) has molecular structure like: [CH2O]N, where N is some integer • refer to this as “unit block”: C6H12O6 has N=6 • Carbohydrate reaction: [CH2O]N + NO2 NCO2 + NH2O+ energy 1 g1.07 g1.47 g0.6 g17 kJ • Less energy than hydrocarbons because one oxygen already on board (half-reacted already) • For every pound of food you eat, exhale 1.5 lbs CO2 • Actually lose weight this way: 0.5 to 1.0 lbs per day in carbon • Must account for “borrowed” oxygen mass and not count it
So where does our petroleum go? • Each barrel of crude oil goes into a wide variety of products • Most goes into combustibles • Some goes to lubricants • Some goes to pitch and tar • Some makes our plastics • 35−40% of our energy comes from petroleum
Let’s get our barrels straight • An oil barrel (bbl) is 42 gallons, or 159 liters • In the U.S., we use about 22 bbl per year per person • average person goes through a barrel in 16 days • recall: ~60 bbl/yr oil equivalent in all forms of energy: oil is ~35% of our total energy portfolio • That’s 6.9 billion bbl/yr for the U.S. • 19 million bbl/day • 10 domestic, 9 imported, in 2011 • For the world, it’s about 30 billion bbl/year • 85 million bbl/day
Notes on Table 2.2 • Not a single country matching U.S. demand of 19 Mbbl/day • Reserves: • Non-OPEC proved reserves: 173 Gbbl • OPEC reserves: 882 Gbbl • Total: 1055 Gbbl • To maintain current production of 85 Mbbl/day… • this will last 34 years • means entries in previous table with longer timescales than this would have to step up production, if they can • may not be possible to extract oil fast enough for demand • Saudi Arabia used to produce at less than 100% capacity, now running full-out
How long will the world oil supply last? • Not as long as you might think/hope • We’ll be spent before the century is done, but we’ll have to scale down oil usage before then (in the next few decades)
How about the U.S. Supply? • The estimated total U.S. supply is 230–324 billion bbl • We’ve used >60% of this, leaving 130 billion barrels • Production is already down to 60% of peak • At current rate of production, will be exhausted before 2070 • If we used only U.S. supply, we’d run out in 18 years!! • includes bet that we find 105 billion barrels more in U.S. Q
From EIA AER 2012 • Peak of U.S. oil production in 1970 • bump when Alaska came online • Recent uptick in domestic oil & NGPL • together with recession-induced reduction in demand makes net imports go below domestic production for first time in ~15 years
Discovery must lead production • There must be a lag between the finding of oil and delivery to market • In the U.S., discovery peaked around 1950, production peaked in 1970
Various Estimates of Oil Remaining • To date, we’ve used about 1000 billion barrels of oil worldwide • We seem to have about this much left • halfway through resource • There will be some future discovery still, but not likely any new Saudi Arabia • ANWR: 5–10 Gbbl 1 years’ worth at U.S. consumption rate • In any case, global production unlikely to increase appreciably from this point forward • despite U.S. production uptick, total world is flatline • will soon fail to pump as fast as today’s demand Q
Worldwide Discovery and Production • discovery peaked before 1970; production peak soon to follow we’ve been using oil faster than we find new oil since 1983
The Hubbert Peak Idea • Hitting new oil field must precede assessment of oil capacity • Discovery peak (numerical assessment) must follow hits • Production peak follows discovery (assessment) • Area under three curves the same (total oil resource) • Deffeyes estimates that we’ve hit 94%, discovered 82%, and produced 50% as of about 2005 graphic attribution: Deffeyes
Logistic (“S”) curves exponential rate of growth Logistic curves result from growth limited by a finite resource: at first exponential, but unable to sustain exponential once resource limits kick in logistic Qmax resource production rate marks half-way point time Qmax resource time
Rate plot for U.S. • Can plot rate of production (P: annual production) divided by resource (Q: total produced to date) against total resource, Q • P/Q is like an interest rate: fractional increase per year • A “logistic” or S-curve would follow a straight line sloping down • U.S. oil production does so after 1958 • When you get to zero P/Q, you’ve hit the end of the resource: no more growth Peak Production; half consumed 1970 graphic attribution: Deffeyes
Same fit, in rate history plot • The best-fit line on the previous plot produces a decent fit to the rate history of oil production in the U.S. • Supports the peak position well, and implies a total resource of about 225 Gbbl graphic attribution: Deffeyes
World Data • After 1983, world data follows logistic curve • shows us halfway along 2,000 Gbbl at 2005 (now-ish) • implies the peak is imminent graphic attribution: Deffeyes Q
gasliquid deep-water arctic tar sands all others EU Russia USA was “Saudi Arabia” of world until about 1960 mid-east USA http://www.oilposter.org/
Discouragement of Oil Usage • In this country, there is no such thing • U.S. taxes on gasoline are 6.5 times lower than in most industrialized countries (about 32 cents per gallon in the U.S.) • The Frito Lay attitude: Burn all you want—we’ll pump more • Efforts on the part of the U.S. to keep oil prices low have lead to numerous questionable actions on the international scene 2Q
Natural Gas • Conventionally, extracted as oil-drilling byproduct • was once burned off at well head as means of disposal • Mostly methane, some ethane, and a little propane, butane • Well-suited to on-the-spot heat generation: water heaters, furnaces, stoves/ovens, clothes dryers • more efficient than using fossil-fuel-generated electricity • Currently ~4 times cheaper than electricity per energy content, 3× cheaper than gasoline per joule • volatile price history • Hydraulic Fracturing (“fracking”) changing scene
Fracking Creates Uptick, Lowers Price fracking uptick
Uses of Natural Gas • Mostly for industrial processes • Electricity generation climbing fast • Transportation dragging along at the bottom
Distribution of natural gas • Impractical to ship: must route by pipe • 1.3 million miles of pipe (250,000 miles of mains)
How much do we use, and where do we get it? • In 2011, we used 24.4 tcf (Tera-cubic feet, or 1012ft3); about 25 QBtu (26% of total) • Out of the 24.4 tcf used, 86% was domestic • Lion’s share from Canada, dribbles from Algeria, Mexico • Have used about 1,300 tcf to date Q
How much do we have left (pre-fracking)? • Estimated recoverable amount: 871 tcf • 40 years at current rate • Estimates like this do account for future discoveries • present proven reserves provide only 8 years’ worth
EIA Projections • In Energy Outlook 2012 document: • expect continued decline in traditional forms • shale gas expected to explode • prices expected to stay low • pay no attention to past volatility! • My worry: extrapolation based on low-hanging fruit • the easiest/best stuff exploited first • not enough history to make robust prediction Q
Coal • Coal is a nasty fuel that we seem to have a lot of • Primarily carbon, but some volatiles (CO, CH4) • Reaction is essentially C + O2 CO2+ energy • Energy content varies depending on quality of coal, ranging from 4–7 Cal/g • Highly undesirable because of large amounts of ash, sulphur dioxide, arsenic, and other pollutants • Also ugly to remove from the ground
Coal types and composition kJ/g Natural Graphite fixed carbon 34 ash Anthracite 29 Bituminous 35 Bituminous 31 sub- bituminous 27 Lignite 25 moisture content Peat 21 volatile matter Wood 20
Use of Coal • 93% of the coal used in the U.S. makes steam for electricity generation • 7% is used for industry (largely steel production) • 0.1% used on Halloween for trick-or-treaters • Usage profile has changed a lot in last ~60 years
Estimated Worldwide Coal Reserves *1st edition of book had U.S. at 1500 billion tons. What happened to all that coal? †1st edition of book had Russian coal at 4300 billion tons. Gross overestimates?
When will coal run out? • We use 109 tonnes of coal per year, so the U.S. supply alone could last as long as 250 years at current rate • Using variable rate model, more like 75–100 years • especially relevant if oil, gas are gone • This assumes global warming doesn’t end up banning the use of coal • Environmental concerns over extraction also relevant
Shale Oil • Possibly 600–2000 billion barrels of oil in U.S. shale deposits • compare to total U.S. oil supply of 230 billion bbl • Economically viable portion may only be 80 billion bbl • 8 times less energy density than coal • lots of waste rock: large-scale disposal problem • Maximum rate of extraction may be only 5% of our current rate of oil consumption • limited by water availability: requires 3 as much water as oil • contaminated process water is an issue
Tar Sands • Sand impregnated with viscous tar-like sludge • Huge deposit in Alberta, Canada • 300 billion bbl possibly economically recoverable • update: 2007 estimate from Alberta Energy at 133 Gbbl • It takes two tons of sands to create one barrel of oil • energy density similar to that of shale oil • In 2003, 1 million bbl/day produced • grand hopes for 3 Mbbl/day; or 4% of world oil production • current rate is up to 1.3 Mbbl/day • Production cost is about $30 per barrel, so economically competitive
References and Assignments • Hubbert’s Peak: The Impending World Oil Shortage, by Kenneth Deffeyes • Beyond Oil, by same author • Out of Gas: The end of the Age of Oil, by David Goodstein • The Party’s Over, by Richard Heinberg • Read Chapter 2 in book • Read Chapter 3 for next week/lecture • HW3 available on website, due Friday 4/26 • Quiz 2 due by Friday, 4/19 at 11:59 PM on TED