Chapter 11 Inferences About Population Variances
530 likes | 976 Vues
Chapter 11 Inferences About Population Variances. Inference about a Population Variance. Inferences about Two Population Variances. Inferences About a Population Variance. Chi-Square Distribution Interval Estimation Hypothesis Testing. Chi-Square Distribution.

Chapter 11 Inferences About Population Variances
E N D
Presentation Transcript
Chapter 11 Inferences About Population Variances • Inference about a Population Variance • Inferences about Two Population Variances
Inferences About a Population Variance • Chi-Square Distribution • Interval Estimation • Hypothesis Testing
Chi-Square Distribution • The chi-square distributionis the sum of squared standardized normal random variables such as (z1)2+(z2)2+(z3)2 and so on. • The chi-square distribution is based on sampling • from a normal population. • The sampling distribution of (n - 1)s2/ 2 has a chi- square distribution whenever a simple random sample of size n is selected from a normal population. • We can use the chi-square distribution to develop • interval estimates and conduct hypothesis tests • about a population variance.
Examples of Sampling Distribution of (n - 1)s2/ 2 With 2 degrees of freedom With 5 degrees of freedom With 10 degrees of freedom 0
We will use the notation to denote the value for the chi-square distribution that provides an area of a to the right of the stated value. Chi-Square Distribution • For example, there is a .95 probability of obtaining a c2 (chi-square) value such that
Interval Estimation of 2 .025 .025 95% of the possible 2 values 2 0
Interval Estimation of 2 • There is a (1 – a) probability of obtaining a c2 value such that • Substituting (n – 1)s2/s 2 for the c2 we get • Performing algebraic manipulation we get
Interval Estimation of 2 • Interval Estimate of a Population Variance where the values are based on a chi-square distribution with n - 1 degrees of freedom and where 1 - is the confidence coefficient.
Interval Estimation of • Interval Estimate of a Population Standard Deviation Taking the square root of the upper and lower limits of the variance interval provides the confidence interval for the population standard deviation.
Interval Estimation of 2 Buyer’s Digest rates thermostats manufactured for home temperature control. In a recent test, 10 thermostats manufactured by ThermoRite were selected and placed in a test room that was maintained at a temperature of 68oF. The temperature readings of the ten thermostats are shown on the next slide. • Example: Buyer’s Digest (A)
Interval Estimation of 2 • Example: Buyer’s Digest (A) We will use the 10 readings below to develop a 95% confidence interval estimate of the population variance. Thermostat1 2 3 4 5 6 7 8 9 10 Temperature 67.4 67.8 68.2 69.3 69.5 67.0 68.1 68.6 67.9 67.2
Our value Interval Estimation of 2 For n - 1 = 10 - 1 = 9 d.f. and a = .05 Selected Values from the Chi-Square Distribution Table
Interval Estimation of 2 For n - 1 = 10 - 1 = 9 d.f. and a = .05 .025 Area in Upper Tail = .975 2 0 2.700
Our value Interval Estimation of 2 For n - 1 = 10 - 1 = 9 d.f. and a = .05 Selected Values from the Chi-Square Distribution Table
Interval Estimation of 2 n - 1 = 10 - 1 = 9 degrees of freedom and a = .05 Area in Upper Tail = .025 .025 2 0 19.023 2.700
Interval Estimation of 2 • Sample variance s2 provides a point estimate of 2. • A 95% confidence interval for the population variance is given by: .33 <2 < 2.33
Hypothesis TestingAbout a Population Variance Lower-tail test: H0: σ2σ02 H1: σ2< σ02 Upper-tail test: H0: σ2≤σ02 H1: σ2> σ02 Two-tail test: H0: σ2= σ02 H1: σ2≠σ02 a a a/2 a/2 Reject H0 if Reject H0 if or Reject H0 if
Hypothesis TestingAbout a Population Variance Recall that Buyer’s Digest is rating ThermoRite thermostats. Buyer’s Digest gives an “acceptable” rating to a thermo- stat with a temperature variance of 0.5 or less. • Example: Buyer’s Digest (B) We will conduct a hypothesis test (with a = .10) to determine whether the ThermoRite thermostat’s temperature variance is “acceptable”.
Hypothesis TestingAbout a Population Variance • Example: Buyer’s Digest (B) Using the 10 readings, we will conduct a hypothesis test (with a = .10) to determine whether the ThermoRite thermostat’s temperature variance is “acceptable”. Thermostat1 2 3 4 5 6 7 8 9 10 Temperature 67.4 67.8 68.2 69.3 69.5 67.0 68.1 68.6 67.9 67.2
Hypothesis TestingAbout a Population Variance • Hypotheses • Rejection Rule Reject H0 if c 2> 14.684
Our value Hypothesis TestingAbout a Population Variance For n - 1 = 10 - 1 = 9 d.f. and a = .10 Selected Values from the Chi-Square Distribution Table
Hypothesis TestingAbout a Population Variance • Rejection Region Area in Upper Tail = .10 2 14.684 0 Reject H0
Hypothesis TestingAbout a Population Variance • Test Statistic The sample variance s 2 = 0.7 • Conclusion Because c2 = 12.6 is less than 14.684, we cannot reject H0. The sample variance s2 = .7 is insufficient evidence to conclude that the temperature variance for ThermoRite thermostats is unacceptable.
Hypothesis TestingAbout a Population Variance • Using the p-Value • The rejection region for the ThermoRite • thermostat example is in the upper tail; thus, the • appropriate p-value is less than .90 (c 2 = 4.168) • and greater than .10 (c 2 = 14.684). A precise p-value can be found using Minitab or Excel. • Because the p –value > a = .10, we • cannot reject the null hypothesis. • The sample variance of s 2 = .7 is • insufficient evidence to conclude that the • temperature variance is unacceptable (>.5).
Hypothesis Tests for Two Variances Tests for Two Population Variances • Goal: Test hypotheses about two population variances H0: σx2σy2 H1: σx2 < σy2 Lower-tail test F test statistic H0: σx2 ≤ σy2 H1: σx2 > σy2 Upper-tail test H0: σx2 = σy2 H1: σx2 ≠ σy2 Two-tail test The two populations are assumed to be independent and normally distributed
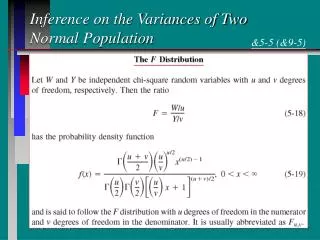
F分布 F分布定义为:设X、Y为两个独立的随机变量,X服从自由度为m的卡方分布,Y服从自由度为n的卡方分布,这2 个独立的卡方分布被各自的自由度除以后的比率这一统计量的分布即: F=(x/m)/(y/n) 服从自由度为(m,n)的F-分布, 上式F服从第一自由度为m,第二自由度为n的F分布
F分布 • F分布的性质 1、它是一种非对称分布; 2、它有两个自由度,即n1 -1和n2-1,相应的分布记为F( n1 –1, n2-1), n1 –1通常称为分子自由度, n2-1通常称为分母自由度; 3、F分布是一个以自由度n1 –1和n2-1为参数的分布族,不同的自由度决定了F 分布的形状。 4、F分布的倒数性质:Fα,df1,df2=1/F1-α,df2,df1
Hypothesis Tests for Two Variances (continued) The random variable Tests for Two Population Variances F test statistic Has an F distribution with (nx – 1) numerator degrees of freedom and (ny – 1) denominator degrees of freedom Denote an F value with 1 numerator and 2 denominator degrees of freedom by
Test Statistic Tests for Two Population Variances The critical value for a hypothesis test about two population variances is F test statistic where F has (nx – 1) numerator degrees of freedom and (ny – 1) denominator degrees of freedom
Hypothesis Testing About theVariances of Two Populations • One-Tailed Test • Hypotheses Denote the population providing the larger sample variance as population 1. • Test Statistic
Hypothesis Testing About theVariances of Two Populations • One-Tailed Test (continued) • Rejection Rule Critical value approach: Reject H0 if F>F where the value of Fis based on an F distribution with n1 - 1 (numerator) and n2 - 1 (denominator) d.f. Reject H0 if p-value <a p-Value approach:
Hypothesis Testing About theVariances of Two Populations • Two-Tailed Test • Hypotheses Denote the population providing the larger sample variance as population 1. • Test Statistic
虽然我们可以通过以上公式求左侧F值,但通常在进行假设检验计算时,只需知道右侧F值。进行 假设检验时,可以随意规定哪个总体是总体1或总体2,我们用总体1来代表方差较大的总体时,只有在右侧才有可能出现H0被拒绝的情况。虽然左侧临界值仍存在,但我们不需要知道它值,因为使用方差较大的总体作为总体1,s12/s22往往出现在右侧。
Hypothesis Testing About theVariances of Two Populations • Two-Tailed Test (continued) • Rejection Rule Critical value approach: Reject H0 if F>F/2 where the value of F/2 is based on an F distribution with n1 - 1 (numerator) and n2 - 1 (denominator) d.f. Reject H0 if p-value <a p-Value approach:
Decision Rules: Two Variances Use sx2 to denote the larger variance. H0: σx2 = σy2 H1: σx2 ≠ σy2 H0: σx2 ≤ σy2 H1: σx2 > σy2 /2 0 F 0 F Do not reject H0 Reject H0 Do not reject H0 Reject H0 • rejection region for a two-tail test is: where sx2 is the larger of the two sample variances
Hypothesis Testing About theVariances of Two Populations Buyer’s Digest has conducted the same test, as was described earlier, on another 10 thermostats, this time manufactured by TempKing. The temperature readings of the ten thermostats are listed on the next slide. • Example: Buyer’s Digest (C) We will conduct a hypothesis test with = .10 to see if the variances are equal for ThermoRite’s thermostats and TempKing’s thermostats.
Hypothesis Testing About theVariances of Two Populations • Example: Buyer’s Digest (C) ThermoRite Sample Thermostat1 2 3 4 5 6 7 8 9 10 Temperature 67.4 67.8 68.2 69.3 69.5 67.0 68.1 68.6 67.9 67.2 TempKing Sample Thermostat1 2 3 4 5 6 7 8 9 10 Temperature 67.7 66.4 69.2 70.1 69.5 69.7 68.1 66.6 67.3 67.5
Hypothesis Testing About theVariances of Two Populations • Hypotheses (TempKing and ThermoRite thermostats have the same temperature variance) (Their variances are not equal) • Rejection Rule • The F distribution table (on next slide) shows that with • with = .10, 9 d.f. (numerator), and 9 d.f. (denominator), • F.05 = 3.18. Reject H0 if F> 3.18
Hypothesis Testing About theVariances of Two Populations Selected Values from the F Distribution Table
= 1.768/.700 = 2.53 Hypothesis Testing About theVariances of Two Populations • Test Statistic • TempKing’s sample variance is 1.768 • ThermoRite’s sample variance is .700 • Conclusion • We cannot reject H0. F = 2.53 < F.05 = 3.18. • There is insufficient evidence to conclude that • the population variances differ for the two • thermostat brands.
Hypothesis Testing About theVariances of Two Populations • Determining and Using the p-Value Area in Upper Tail .10 .05 .025 .01 F Value (df1 = 9, df2 = 9) 2.44 3.18 4.03 5.35 • Because F = 2.53 is between 2.44 and 3.18, the area • in the upper tail of the distribution is between .10 • and .05. • But this is a two-tailed test; after doubling the upper- • tail area, the p-value is between .20 and .10. (A precise • p-value can be found using Minitab or Excel.) • Because a = .10, we have p-value > a and therefore • we cannot reject the null hypothesis.