Development and Interpretation of Control Charts
Development and Interpretation of Control Charts. Presented by Dr. Joan Burtner Certified Quality Engineer Associate Professor of Industrial Engineering and Industrial Management. Overview. Shewhart’s Concept of Control Charts Common Types of Control Charts Development of Control Charts

Development and Interpretation of Control Charts
E N D
Presentation Transcript
Development and Interpretation of Control Charts Presented by Dr. Joan Burtner Certified Quality Engineer Associate Professor of Industrial Engineering and Industrial Management
Overview • Shewhart’s Concept of Control Charts • Common Types of Control Charts • Development of Control Charts • Interpretation of Control Charts • Advanced Topics in Control Charts • Further Reading Dr. Joan Burtner, Assoc. Prof. of Industrial Engineering
Shewhart’s Concept of Control Charts - 1 • “Through the use of the scientific method, extended to take account of modern statistical concepts, it has been found possible to set up limits within which the results of routine effort must lie if they are to be economical. Deviations in the results of a routine process outside such limits indicate that the routine has broken down and will no longer be economical until the cause of trouble is removed..” Devor, Chang, and Sutherland p. 151 Dr. Joan Burtner, Assoc. Prof. of Industrial Engineering
Shewhart’s Concept of Control Charts - 2 • “A phenomenon will be said to be controlled when, through the use of past experience, we can predict, at least within limits, how the phenomenon may be expected to vary in the future. Here it is understood that prediction within limits means that we can state, at least approximately, the probability that the observed phenomenon will fall within the given limits.” Devor, Chang, and Sutherland p. 151 Dr. Joan Burtner, Assoc. Prof. of Industrial Engineering
Shewhart’s Concept of Control Charts - 3 • “That the quality characteristics of the product fall within the specification limits (derived during engineering design) implies that the customer expectations are being met. That the performance of the process also falls within the statistical limits of variation for routine operation (derived from the observed variation in the process) implies that the customer expectations are being met in an economic fashion.” Devor, Chang, and Sutherland p. 151 Dr. Joan Burtner, Assoc. Prof. of Industrial Engineering
Theory of Variation • Common Cause • Stable and predictable causes of variation • Inherent in all processes • Managers, not workers, are responsible for common cause variation • Special Cause • Unexpected or abnormal causes of variation • May result in sudden or extreme departures from normal • May also result in gradual shifts (trends) Dr. Joan Burtner, Assoc. Prof. of Industrial Engineering
Types of Control Charts • Single or multivariate • Track one quality characteristic per chart • Track more than one characteristic on the same chart • Variables or attributes • Variable (measured characteristics) • X-bar, R, S • Attributes (counts) • P (percent non-conforming) • C (count) • U (count per unit) Dr. Joan Burtner, Assoc. Prof. of Industrial Engineering
Development of Control Charts • Choose quality characteristic to be measured or counted • Collect at least 25 samples • Develop trial control limits • Evaluate for special causes • Determine special causes and remediate • Eliminate out-of-control points • Recalculate control limits • Continue until chart shows process is in control • Monitor process using established control limits Dr. Joan Burtner, Assoc. Prof. of Industrial Engineering
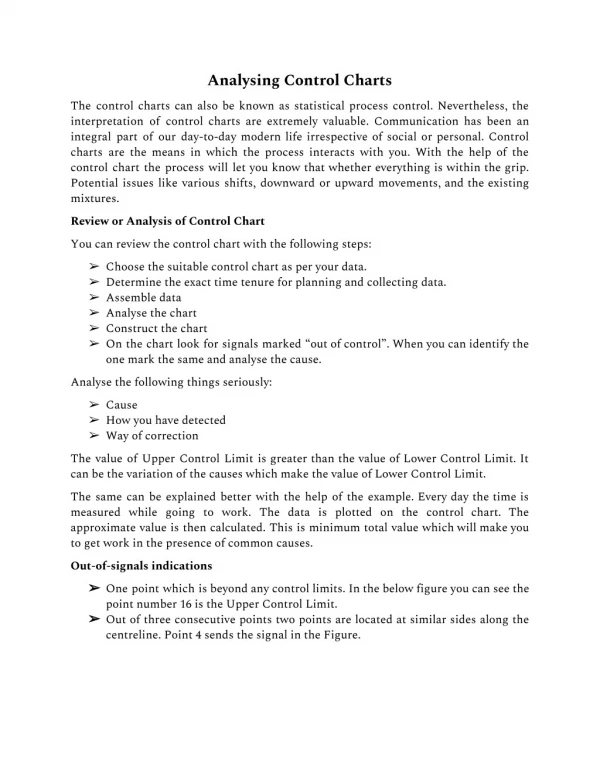
Interpretation of Control Charts – NIST.GOV • “If a single quality characteristic has been measured or computed from a sample, the control chart shows the value of the quality characteristic versus the sample number or versus time. In general, the chart contains a center line that represents the mean value for the in-control process. Two other horizontal lines, called the upper control limit (UCL) and the lower control limit (LCL), are also shown on the chart. These control limits are chosen so that almost all of the data points will fall within these limits as long as the process remains in-control.”http://www.itl.nist.gov/div898/handbook/pmc/section3/pmc31.htm • “Statistical methods to detect sequences or nonrandom patterns can be applied to the interpretation of control charts. To be sure, "in control" implies that all points are between the control limits and they form a random pattern.”http://www.itl.nist.gov/div898/handbook/pmc/section3/pmc31.htm Dr. Joan Burtner, Assoc. Prof. of Industrial Engineering
Interpretation of Control Charts • Look for special cause variation • Points that are outside 3 sigma limits • Series of points that are unusually close to 3 sigma limits • Non-random patterns such as linear trends, oscillation, runs above or below centerline • Textbook tests for special causes differ slightly from Minitab tests Dr. Joan Burtner, Assoc. Prof. of Industrial Engineering
Control Chart Types • Control Charts • Variables – based on continuous data • X bar and R (mean and range) • Attributes - based on discrete data • P (proportion) • C (count) • Example of R Chart: Dr. Joan Burtner, Assoc. Prof. of Industrial Engineering
Control Chart Equations for Variables Charts • Xbar and R Control Chart Constants • Control Chart Calculations Dr. Joan Burtner, Assoc. Prof. of Industrial Engineering
Partial p Chart Data • Data: 30 samples of size 200 each • CL = total defects / total number of samples • Chart built in Excel: Dr. Joan Burtner, Assoc. Prof. of Industrial Engineering
Control Chart Calculations for Proportion Defective (p) • Chart built in Minitab: Dr. Joan Burtner, Assoc. Prof. of Industrial Engineering
Control Chart Data for Number of Defects (c) Sample Number of Number Defects 1 16 2 14 3 28 4 16 5 12 6 20 7 10 8 12 9 30 10 17 11 9 12 17 13 14 14 16 15 15 16 13 17 14 18 16 19 11 20 20 21 11 22 9 23 16 24 31 25 13 Chart built in Excel: Dr. Joan Burtner, Assoc. Prof. of Industrial Engineering
Control Chart Equations for Number of Defects (c) Dr. Joan Burtner, Assoc. Prof. of Industrial Engineering
U Chart Data • Data: 21 samples with varying sample sizes • CL = total defects / total number of items sampled • UCL and LCL vary with sample size • Chart built in Excel: Dr. Joan Burtner, Assoc. Prof. of Industrial Engineering
Control Chart Calculations for Number of Defects per Unit (u) Dr. Joan Burtner, Assoc. Prof. of Industrial Engineering
U Chart Calculations Dr. Joan Burtner, Assoc. Prof. of Industrial Engineering
Further Reading • Christensen, E.H., Coombes-Betz, K.M., and Stein, M.S. (2014). The Certified Quality Process Analyst Handbook. Milwaukee: ASQ Quality Press. • DeVor, R.E., Chang, T., and Sutherland, J.W. (2007). Statistical Quality Design and Control: Contemporary Concepts and Methods (2nd ed.). Upper Saddle River, NJ: Pearson Prentice Hall. • “NIST Information Technology Laboratory” http://www.itl.nist.gov/itl-what_itl_does.htmlsee also: NIST/SEMATECH e-Handbook of Statistical Methods • Westcott, R.T., Ed. (2006). Certified Manager of Quality/Organizational Excellence Handbook (3rd ed.). Milwaukee: ASQ Quality Press. Dr. Joan Burtner, Assoc. Prof. of Industrial Engineering
Contact Information • Email: Burtner_J@Mercer.edu • US Mail: Mercer University School of Engineering 1400 Coleman Avenue Macon, GA • Phone: (478) 301- 4127 Dr. Joan Burtner, Assoc. Prof. of Industrial Engineering