Download
1 / 20
200 likes | 226 Vues
Central Tendency & Range. Central Tendency. Mean , Median , and Mode are the measures of Central Tendency. Central Tendency is a value that describes a data set. Definition :.

E N D
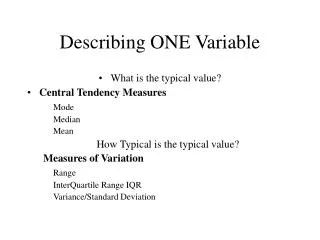
Central Tendency • Mean, Median, and Mode are the measures of Central Tendency. • Central Tendency is a value that describes a data set.
Definition: The MEAN is found by taking the sum of the data and dividing the sum by the total number of values in the set. **The mean is the AVERAGE**
Example #1: Find the mean swimming time (in minutes) rounded to the nearest tenth: 2.6 7.2 3.5 9.8 2.5 The mean swimming time to the nearest tenth is 5.1 minutes. 2.6 + 7.2 + 3.5 + 9.8 + 2.5 = 25.6 25.6 ÷ 5 = 5.12
Example#2: Giada’s Science test scores were 95, 82, 91, and 90. What does she need to get on her next test to have an average of 90 in Science? 92
Definition: The median is the middle number in the set. Calculate the median by listing the data in order from least to greatest. **The median is the MIDDLE**
Example #1: During the first marking period, Nick’s quiz scores were 90, 92, 93, 88, 95, 88, 97, and 87. What was the median score? What if there are two middle numbers? Order the ages from least to greatest: 87, 88, 88, 90, 92, 93, 95, 97
(continued)… The median quiz score was 91. Since there is an even number of items in the data set, we compute the median by taking the average of the two middle numbers. 90 + 92 = 182 182 ÷ 2 = 91
Example #2: Find the median swim times (in minutes): 2.6, 7.2, 3.5, 9.8, 2.5 3.5 minutes
Definition: The mode is the number (or numbers) that appear most often. It is easier to find the mode when numbers are listed in order. **The mode is the MOST**
The number of points scored in a series of football games is listed below. Which score occurred most often? 7, 13, 18, 24, 9, 3, 18 The score which occurs most often is 18. Example#1: Order the ages from least to greatest: 3, 7, 9, 13, 18, 18, 24
Example #2: A marathon race was completed by 5 participants. What is the mode of these times given in hours? 2.7 hr, 8.3 hr, 3.5 hr, 5.1 hr, 4.9 hr Since each value occurs only once, there is no mode for this data set.
Example #3: 11 cars were tested in crash tests to find what impact speed would cause the least damage. Find the mode of the speeds (in mph) given 24, 15, 18, 20, 18, 22, 24, 26, 18, 26, 24 List in Order: 15, 18, 18, 18, 20, 22, 24, 24, 24, 26, 26 Since both18 and 24 occur three times, the modes are 18 and 24 miles per hour.
Definition: The range of a set of data is the difference between the highest and lowest values in the set. **The range is NOTa measure of Central Tendency**
Example#1: The Smith family drove through six Midwestern states on their summer vacation. Gasoline prices varied from state to state. What is the range of gasoline prices? $1.79, $1.61, $1.96, $2.09, $1.84, $1.75 The range of the gasoline prices was $0.48. $2.09 - $1.61 = $0.48
Example#2: Find the range of the swim times (in minutes): 2.6, 7.2, 3.5, 9.8, 2.5 7.3 minutes
Try the following problem: Find the mean, median, mode, & range of the test scores below. Determine the best measure of Central Tendency: 79, 54, 87, 86, 88, 91 Mean = 80.8 Median = 86.5 Mode = NONE Range = 37 Best Measure of Central Tendency:Median
An outlier is an extreme value that greatly affects the data set. **The measureof Central Tendency that is most affected by an outlier: __the mean___**
Students in Mrs. Long’s Tan Class surveyed their class of 25 students to determine each students’ height in inches. Calculate each measure of central tendency: Mean: Mode: Median: 61.16 65 61