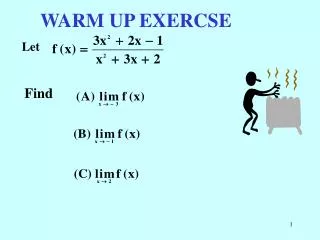
WARM UP EXERCSE
WARM UP EXERCSE. Let. Find. §3.2 Continuity. The student will learn about:. continuity,. continuity properties,. and solving inequalities using continuity properties. Continuity.

WARM UP EXERCSE
E N D
Presentation Transcript
WARM UP EXERCSE Let Find
§3.2 Continuity The student will learn about: continuity, continuity properties, and solving inequalities using continuity properties.
Continuity As we have seen some graphs have holes in them, some have breaks and some have other irregularities. We wish to study each of these oddities. Then through a study of limits we will examine the instantaneous rate of change.
1. 2. f (c) exists 3. THIS IS THE DEFINITION OF CONTINUITY Definition A function f is continuous at a point x = c if
Example 1 f (x) = x – 1 at x = 2. 1 The limit exist! a. b. f (2) = 1 AND ! 1 c. 2 Therefore the function is continuous at x = 2.
Definition A function f is continuous on the open interval (a,b) if it is continuous at each point on the interval. If a function is not continuous it is discontinuous.
Example 2 f (x) = (x2 – 9)/(x + 3) at x = -3 a. - 6 The limit exist! b. f (-3) = 0/0 Is undefined! So -3 c. -6 Therefore the function is not continuous at x = -3.
Example 3 f (x) = |x|/x at x = 0 and at x = 1 a. Does not exist! b. f (0) = 0/0 Undefined! 0 c. Therefore the function is not continuous at x = 0. Notice that the function is continuous at x = 1.
Continuity Properties If two functions are continuous on the same interval, then their sum, difference, product, and quotient are continuous on the same interval except for values of x that make the denominator 0.
Some Special Functions and Continuity • A constant function is continuous for all x. • For n > 0, f (x) = xn is continuous for all x. • A polynomial function is continuous for all x.
For n an odd positive integer, is continuous wherever f (x) is continuous. • For n an even positive integer, is continuous wherever f (x) is continuous and nonnegative. Some Special Functions and Continuity • A rational function is continuous for all x except those values that make the denominator 0.
Solving Inequalities Using Continuity Properties. A tool for analyzing graphs of functions is called a sign chart. A tool for analyzing graphs of functions is called a sign chart. We find where the function is zero or undefined to partition the number line into intervals for testing. A tool for analyzing graphs of functions is called a sign chart. We find where the function is zero or undefined to partition the number line into intervals for testing. We then test each interval to determine if the function is positive (above the x-axis) or negative (below the x-axis) in those intervals.
Constructing Sign Charts. 1. Find all partition numbers. a. Points of discontinuity – where the denominator is 0. b. Points where the function is zero – where the numerator is zero but the denominator is not. 2. Plot these partition numbers on the number line dividing the line into intervals. 3. Select a test number in each interval and determine if f (x) is positive (+) or negative (-) there. 4. Complete your sign chart showing the sign of f (x) on each open interval.
- 3 0 2 Sign Chart - Example. 1. a. Points of discontinuity. Where the denominator is zero. x = 2 1. b. Points where f (x) = 0. Where the numerator is zero. x = 0, x = - 3 2. Place these partition values on a number line. continued
- 3 - 3 0 0 2 2 - - - - - - - + + + + - - - - + + + + + + + Sign Chart - Example. 3. Select test numbers and determine if f (x) is positive or negative. 4. Complete the sign chart. continued
- 3 0 2 - - - - - - - + + + + - - - - + + + + + + + Sign Chart - Example. Remember the plus signs mean the function is above the x-axis while the minus signs mean the function is below the x – axis. We can check this with a graphing calculator. continued
- 3 - 3 0 0 2 2 - - - - - - - + + + + - - - - + + + + + + + - - - - - - - + + + + - - - - + + + + + + + Sign Chart - Example. The > 0 in the original problem means we want greater than 0, the positive signs (where the function is positive). The answer to the problem is then – 3 < x < 0 and x > 2. Or in interval notation (-3,0) and (2,).
Summary. We have developed a definition for determining if a function is continuous. That is the function has no holes or oddities. We have developed a set of properties for limits. AND We have used sign charts to solve inequalities.
Practice Problems §3.2; 1, 5, 7, 9, 11, 13, 15, 19, 23, 25, 27, 31, 35, 39, 41, 45, 49, 53, 55, 59, 63, 67, 75, 79,80.