Download

1 / 10
130 likes | 214 Vues
A bar graph displays student preferences for math, language arts, science, social studies, health/P.E., and art based on survey data. The Y-axis represents number of votes while the X-axis shows subjects.

E N D
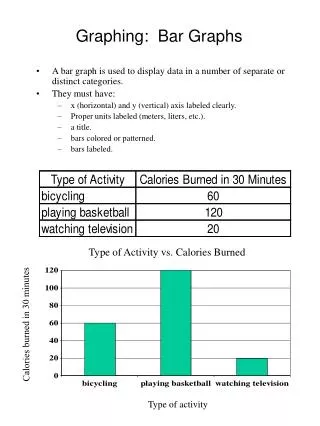
Bar Graph Bar Graph- a graph that displays data using bars of different heights or lengths.
Bar Graph A survey can be used to collect data. The data can then be displayed using a bar graph. Favorite School Subject Math Language Arts Science Social Studies Health/P.E. Art
Favorite School Subject Math Language Arts Science Social Studies Health/ P.E. Art Bar Graph Favorite School Subject 12 10 8 Number of Votes 6 4 2 0 Math Art Science Social St. Lang. Arts Health/P.E. Subjects
Bar Graph The Y axis of this graph uses a scale with an interval of 2. The Y axis shows the number of votes cast. Favorite School Subject 12 10 8 Number of Votes 6 4 2 0 Math Art The X axis shows the subjects. Science Social St. Lang. Arts Health/P.E. Subjects
Favorite School Subject 12 10 8 Number of Votes 6 4 2 0 Math Art Science Social St. Lang. Arts Health/P.E. Subjects Bar Graph How many students prefer math? 10 How many students prefer social studies or language arts? 12 How many more students enjoy art than science? 3 How many students were surveyed? 47
Double Bar Graph The following data can be displayed using a double bar graph. Favorite School Subject Boys Girls Math Language Arts Science Social Studies Health/P.E. Art
Favorite School Subject Boys Girls Math Language Arts Science Social Studies Health/ P.E. Art Double Bar Graph Favorite School Subjects 7 6 5 4 Number of Votes 3 2 1 0 Art Math Science Social St. Lang. Arts Health/P.E. Subjects girls boys
Favorite School Subjects 7 6 5 4 Number of Votes 3 2 1 0 Art Math Science Social St. Lang. Arts Health/P.E. Subjects girls boys Double Bar Graph How many girls prefer art? 6 How many boys prefer math or science? 10 How many more girls enjoy health/P.E. than boys? 4 How many girls participated in the survey? 25
Bar Graph Bar Graph- a graph that displays data using bars of different heights or lengths.